
Monopoly graph with profit, consumer surplus and deadweight loss
An example figure from the Cost and Revenue Curves generator.
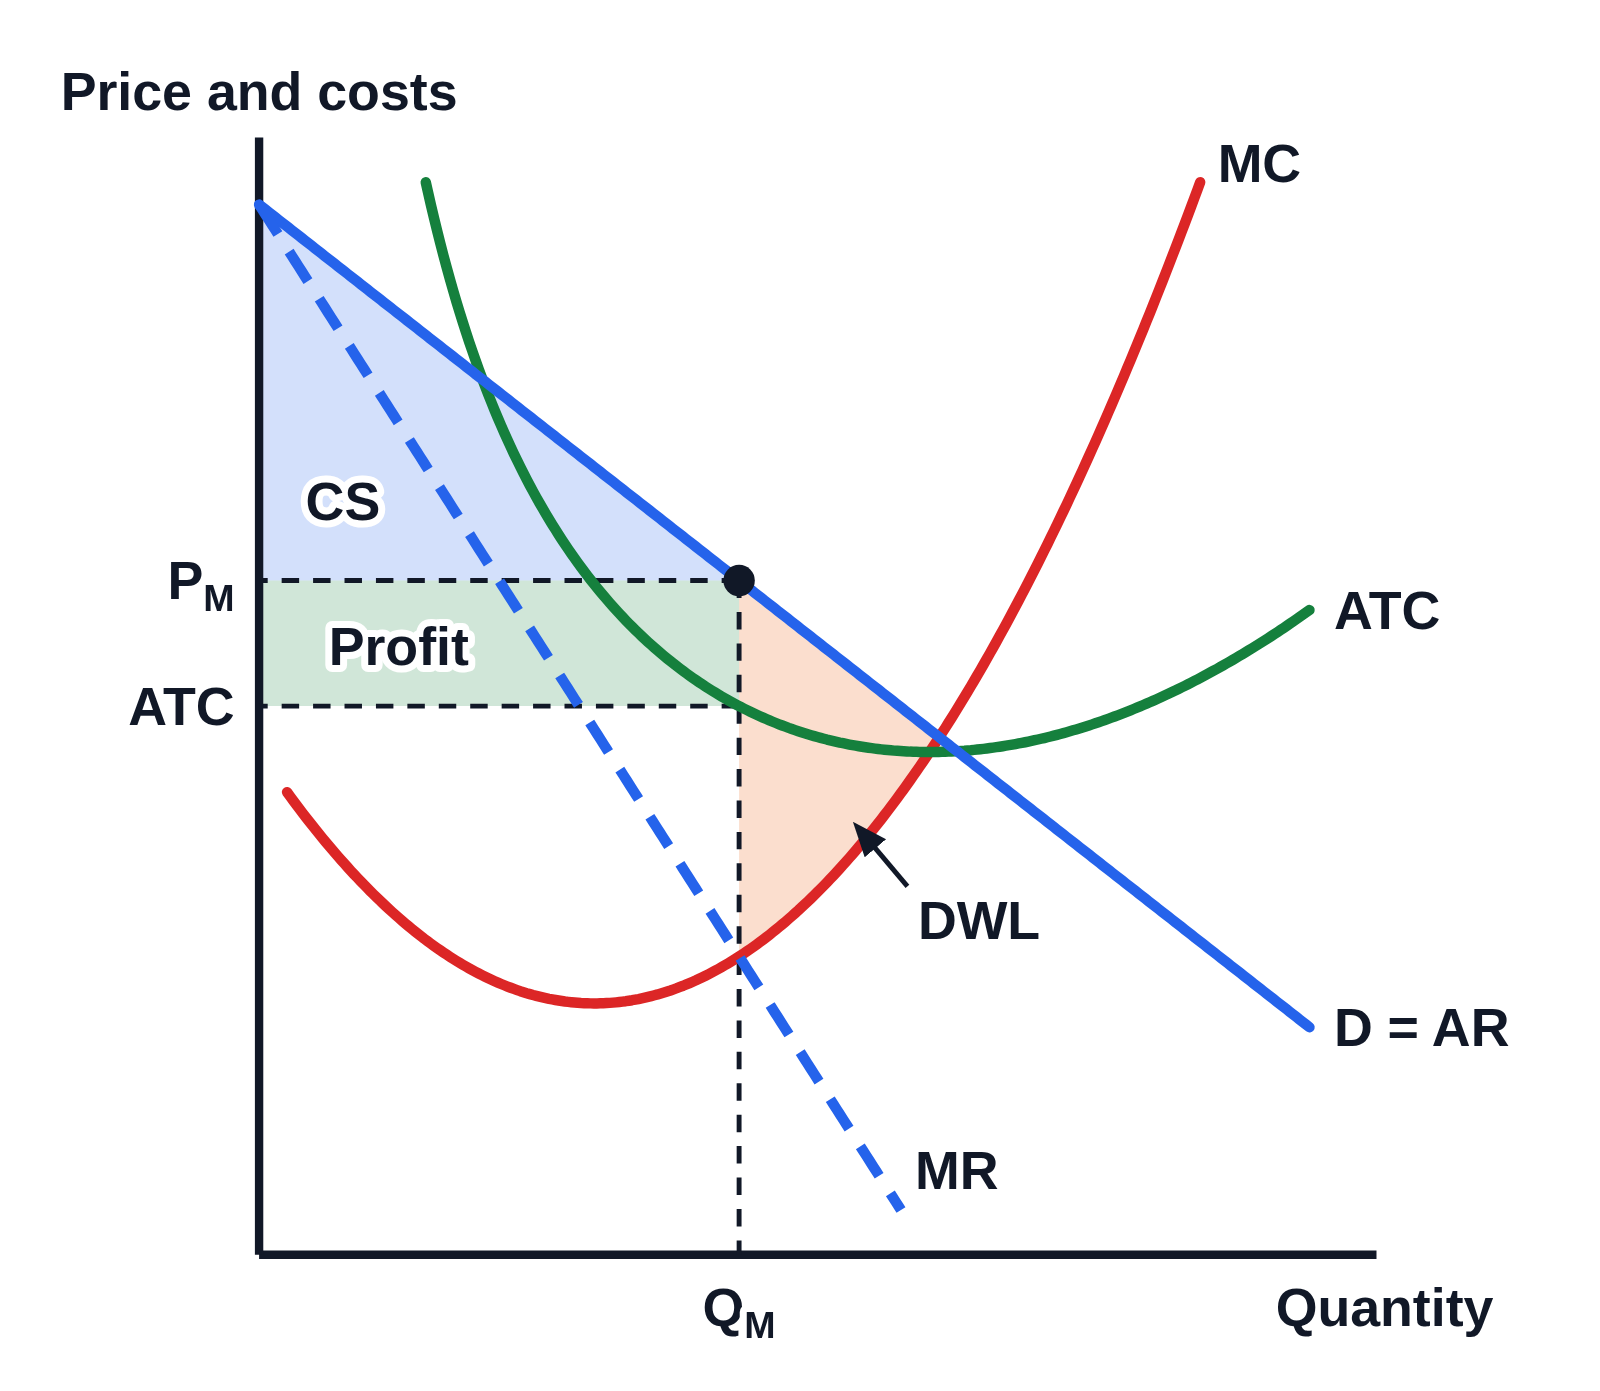
Editing opens it in Cost and Revenue Curves with these settings, to change anything and copy or download your own.
Free to use in your tests, worksheets, slides or anything else, no credit needed. Public domain under CC0 1.0. How to reuse our figures
More Cost and Revenue Curves examples
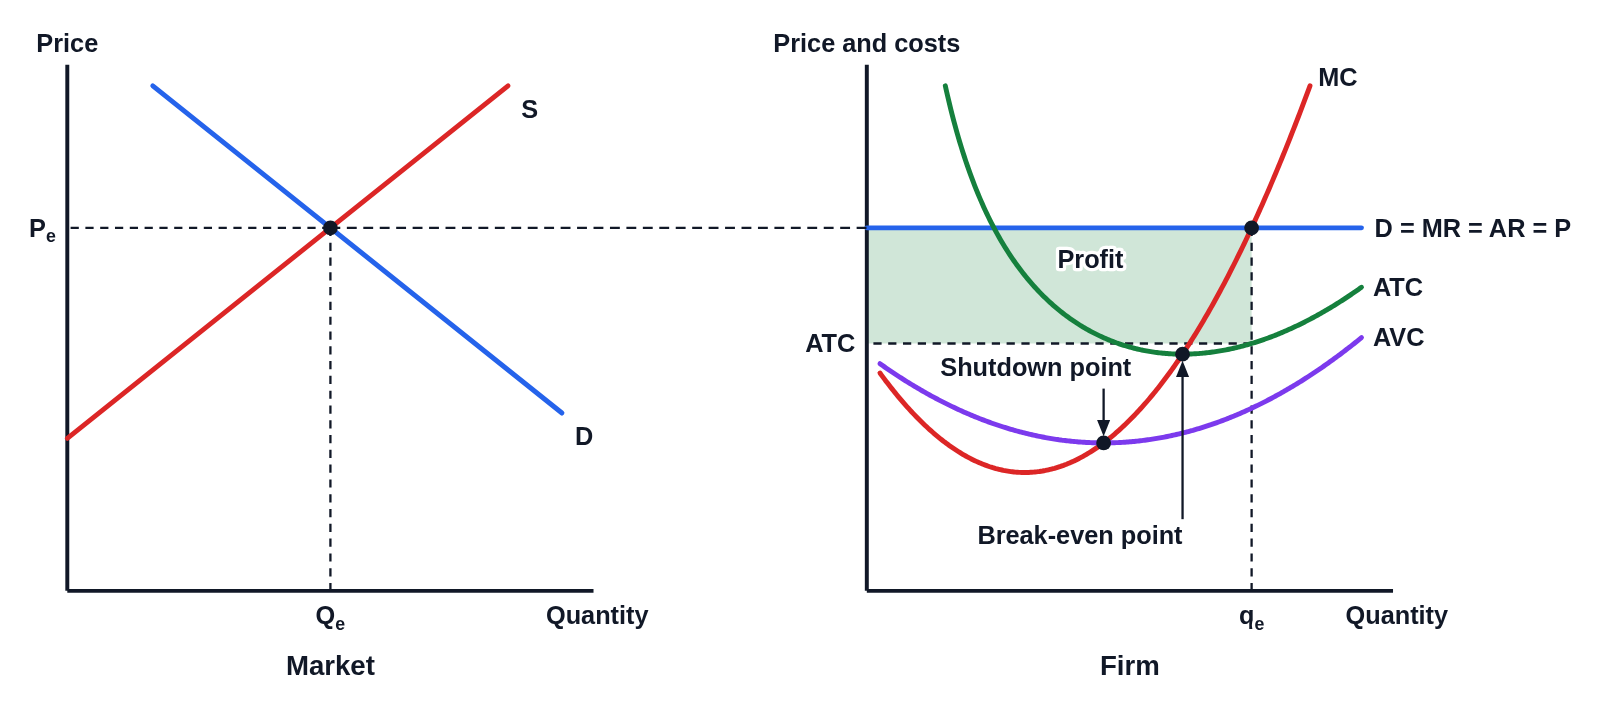 Perfect competition side-by-side graphs: market and firm making an economic profit
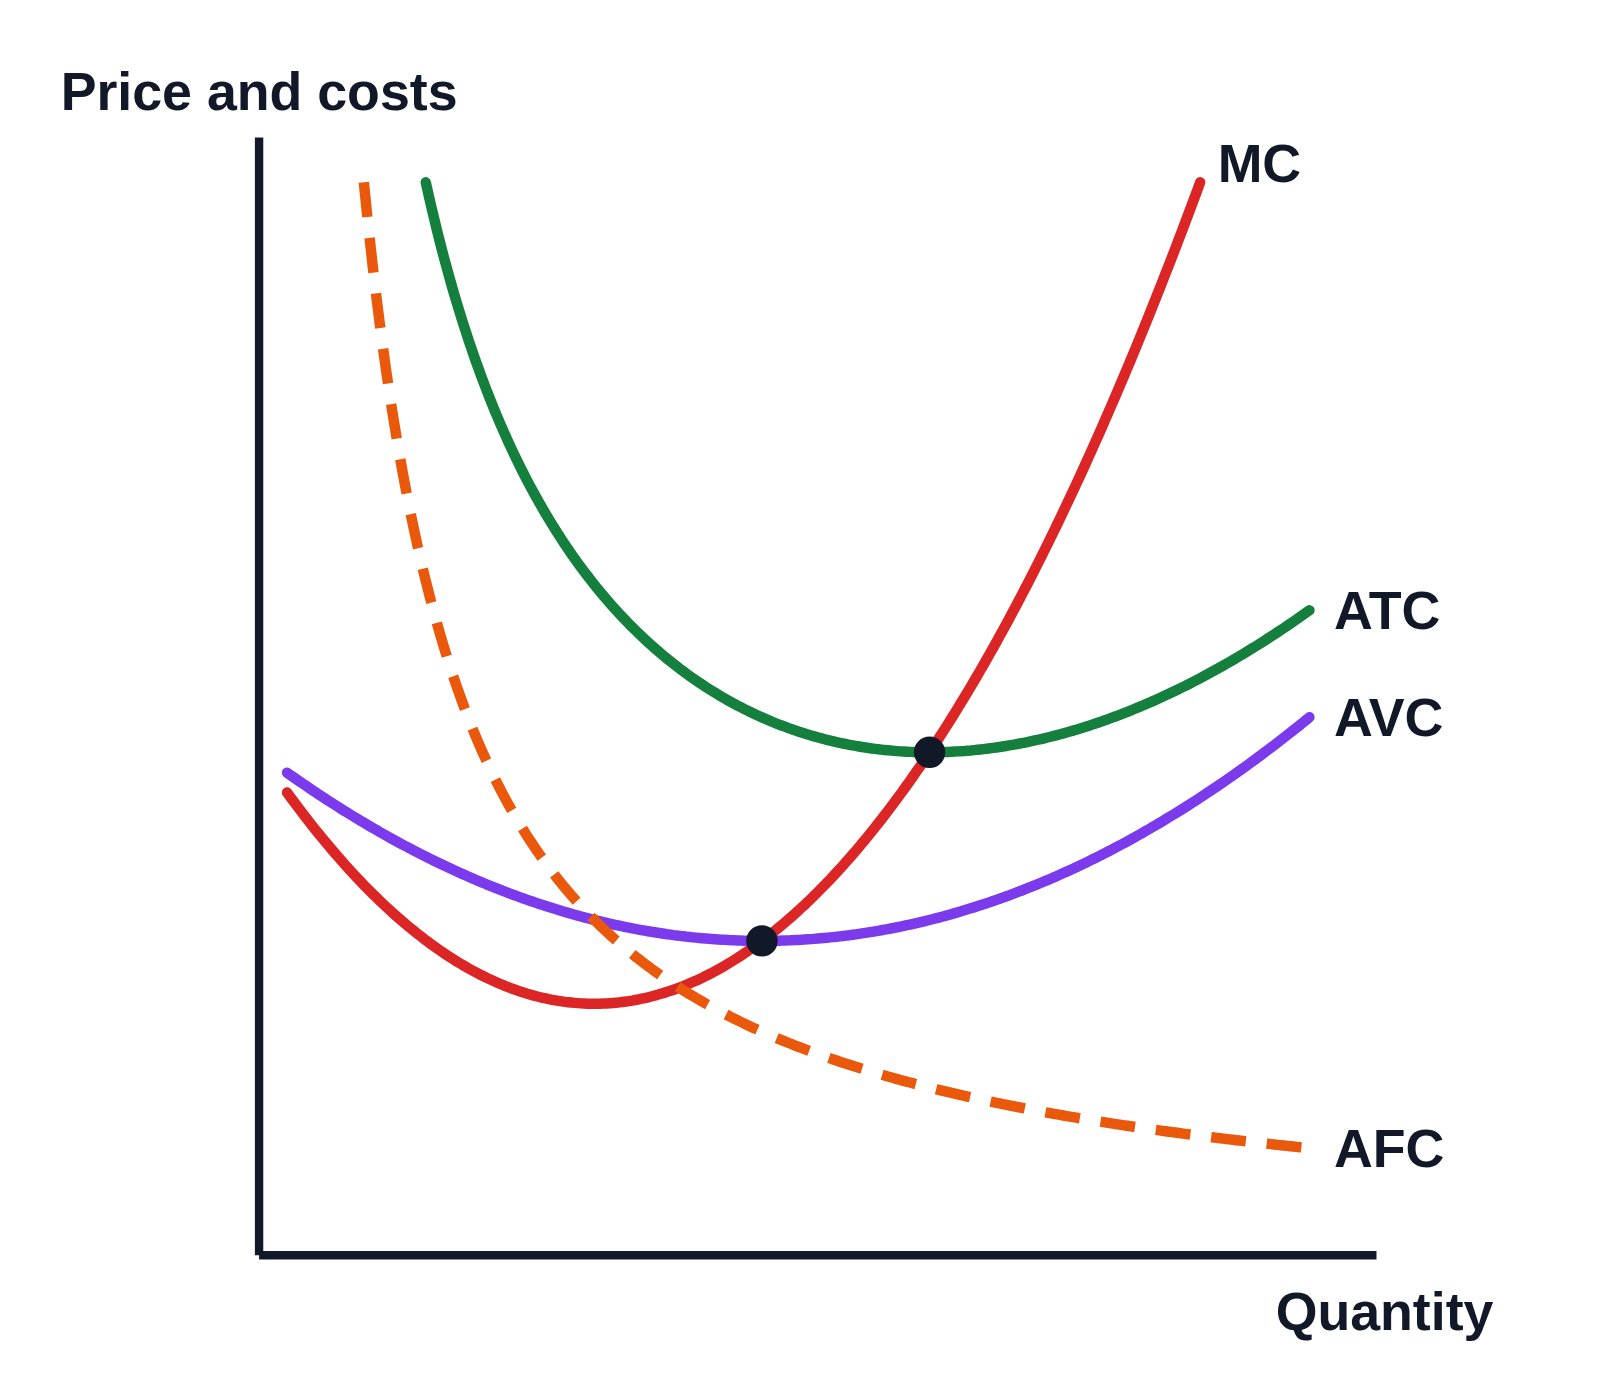 Cost curves graph: MC, ATC, AVC and AFC
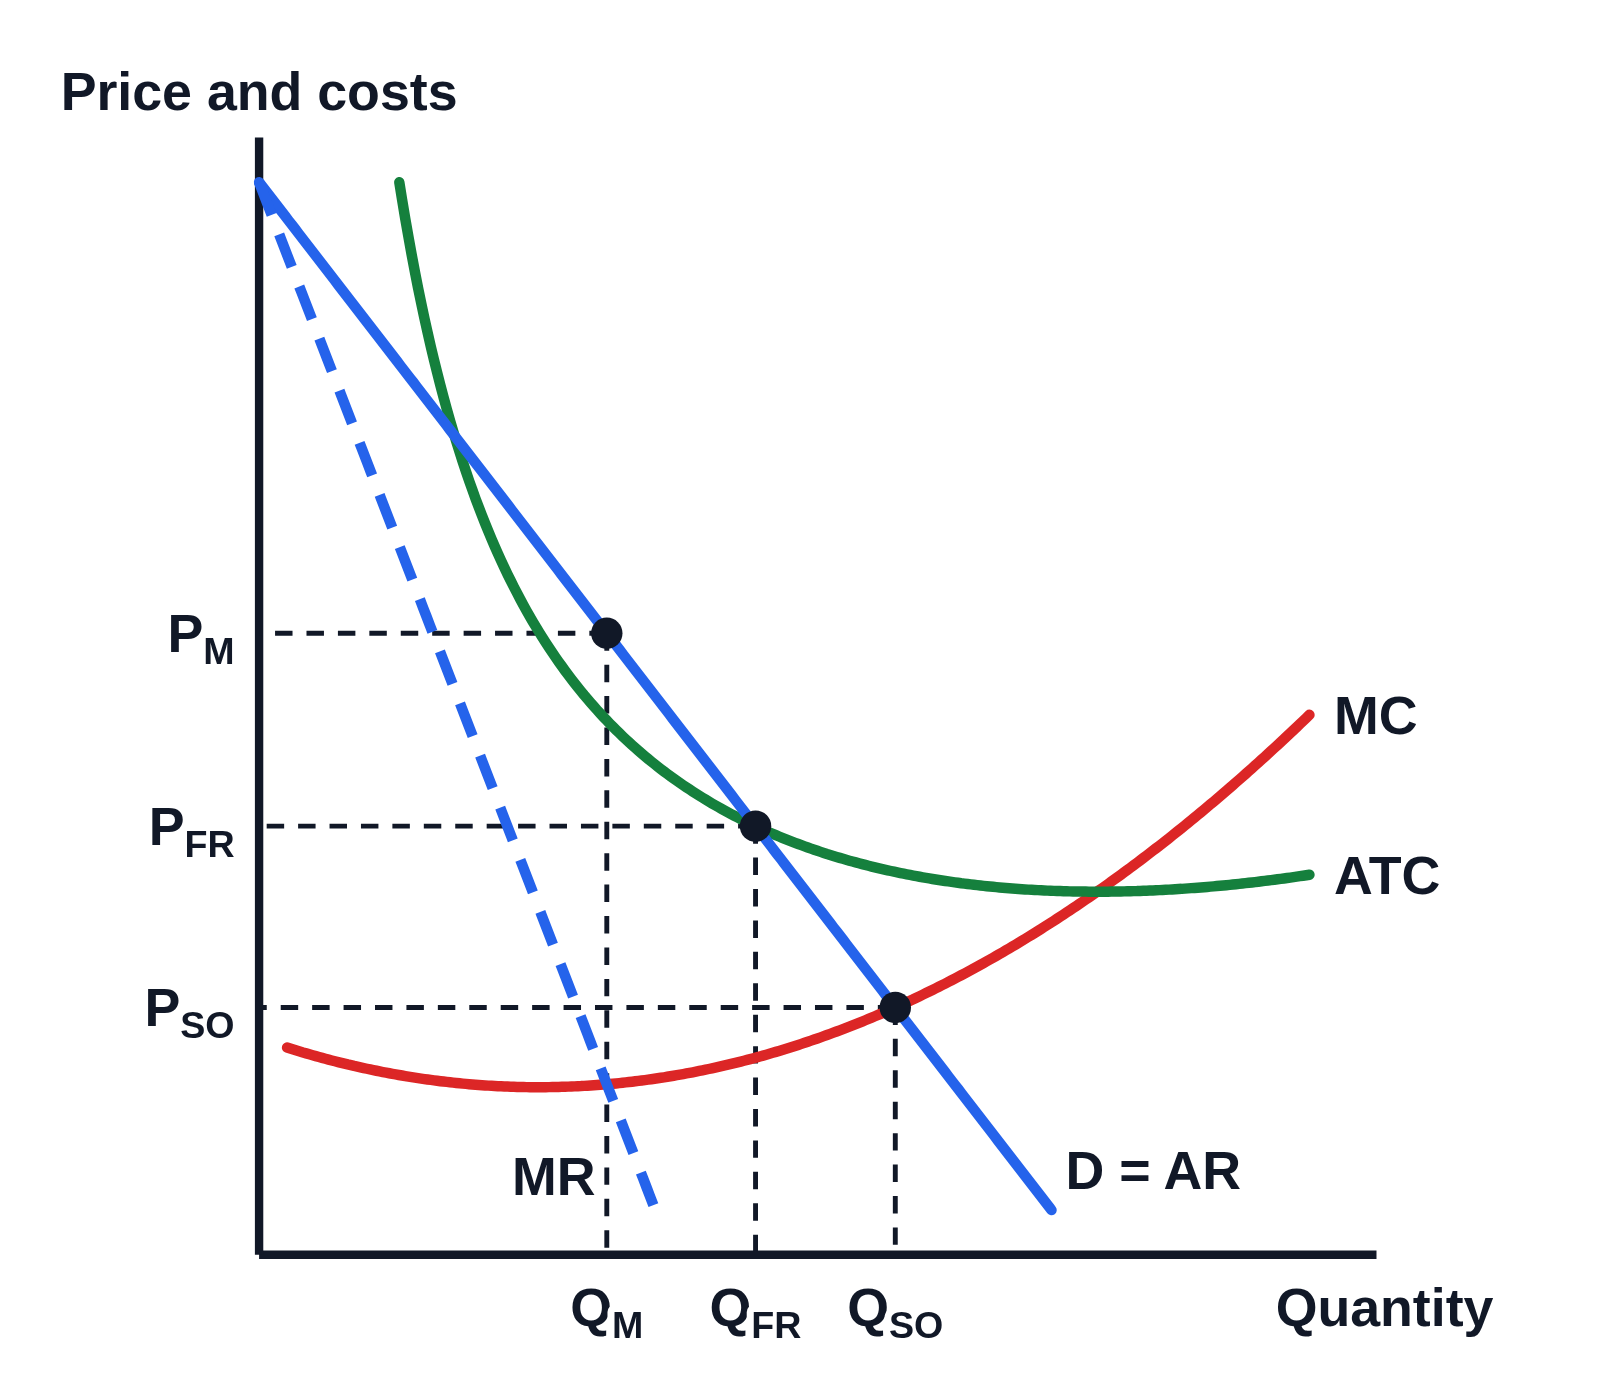 Regulated natural monopoly graph: socially optimal (P = MC) and fair-return (P = ATC) prices
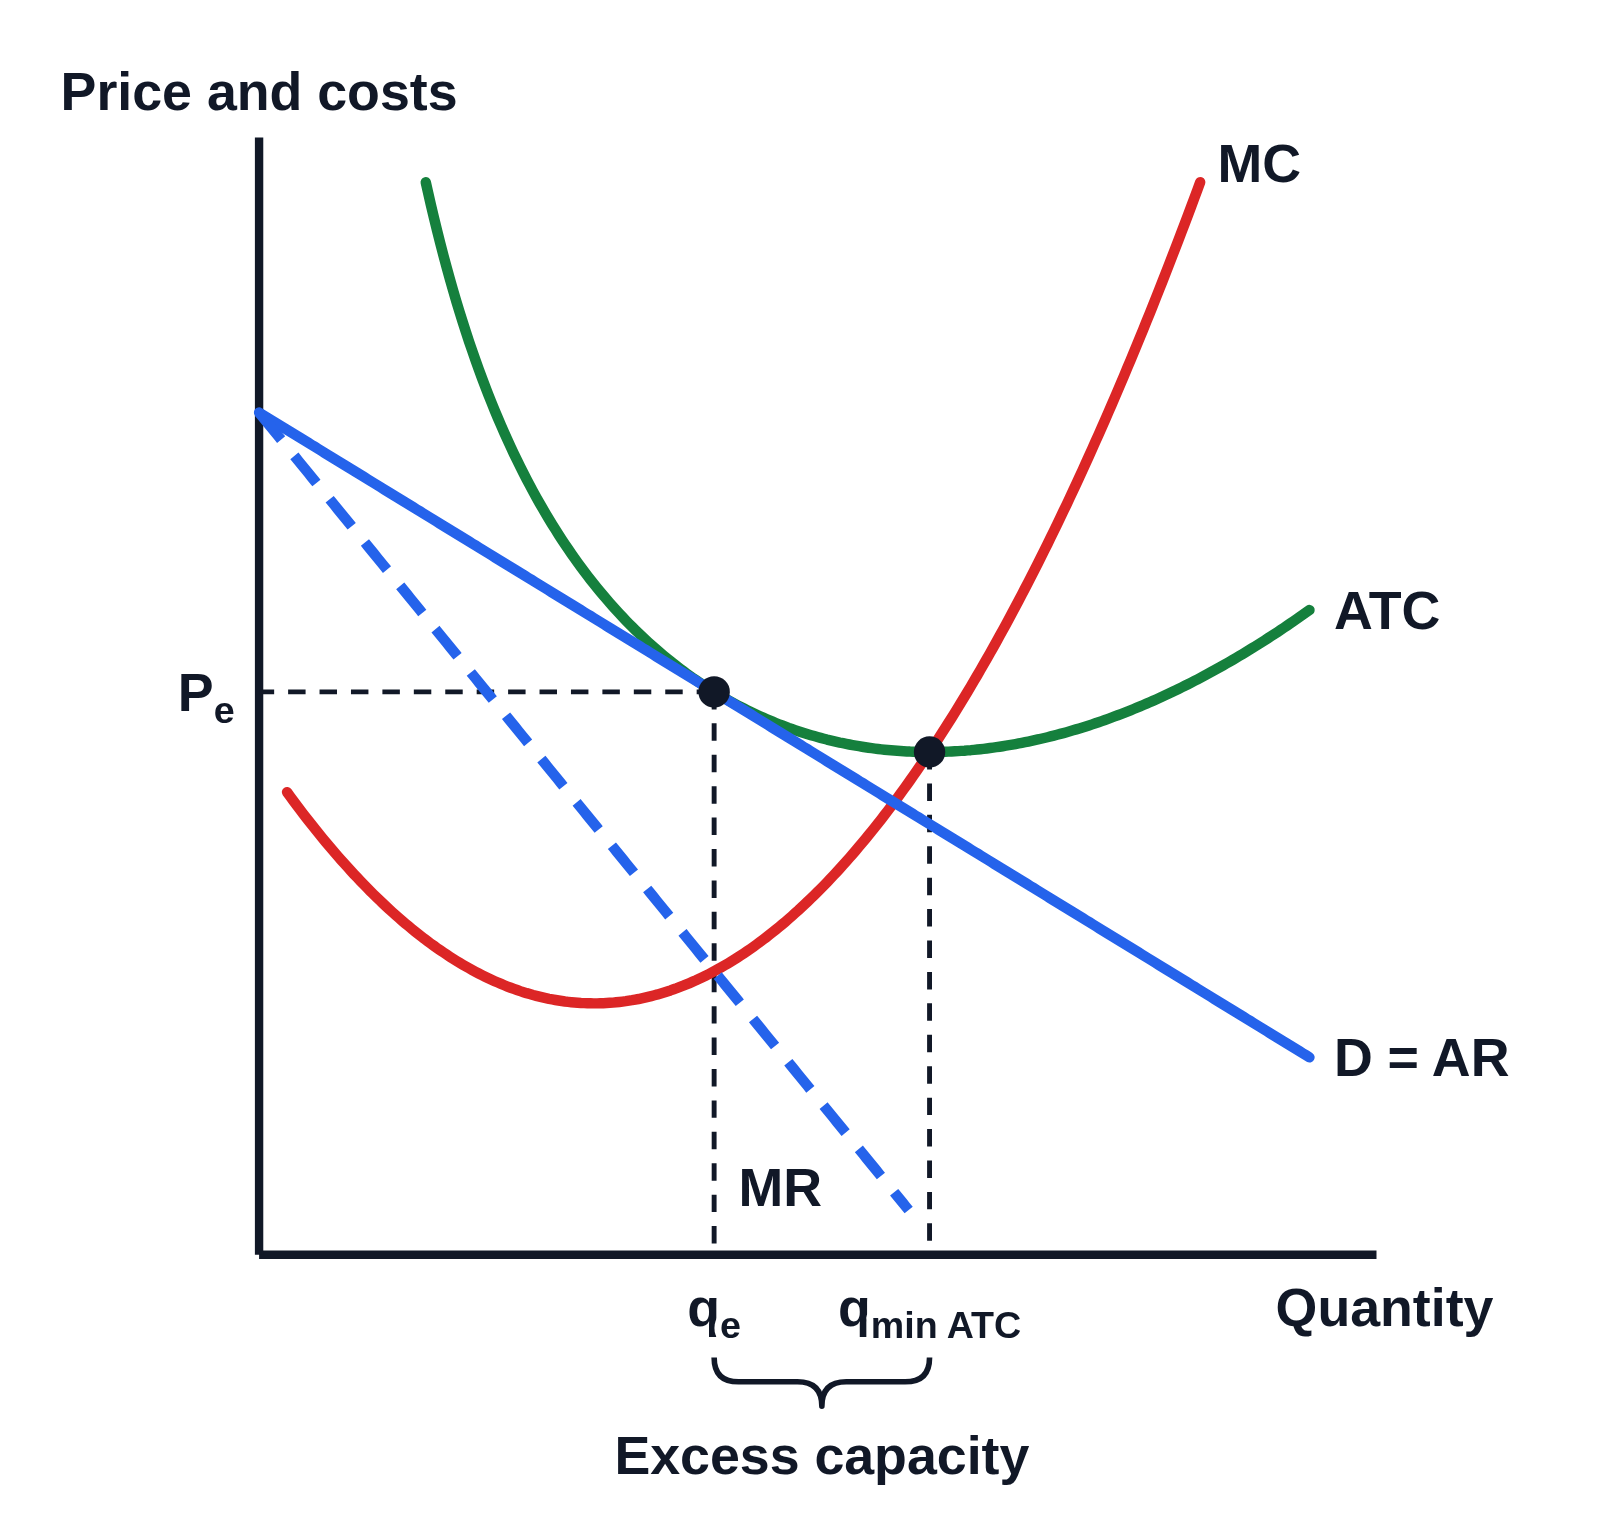 Monopolistic competition long-run equilibrium graph with excess capacity
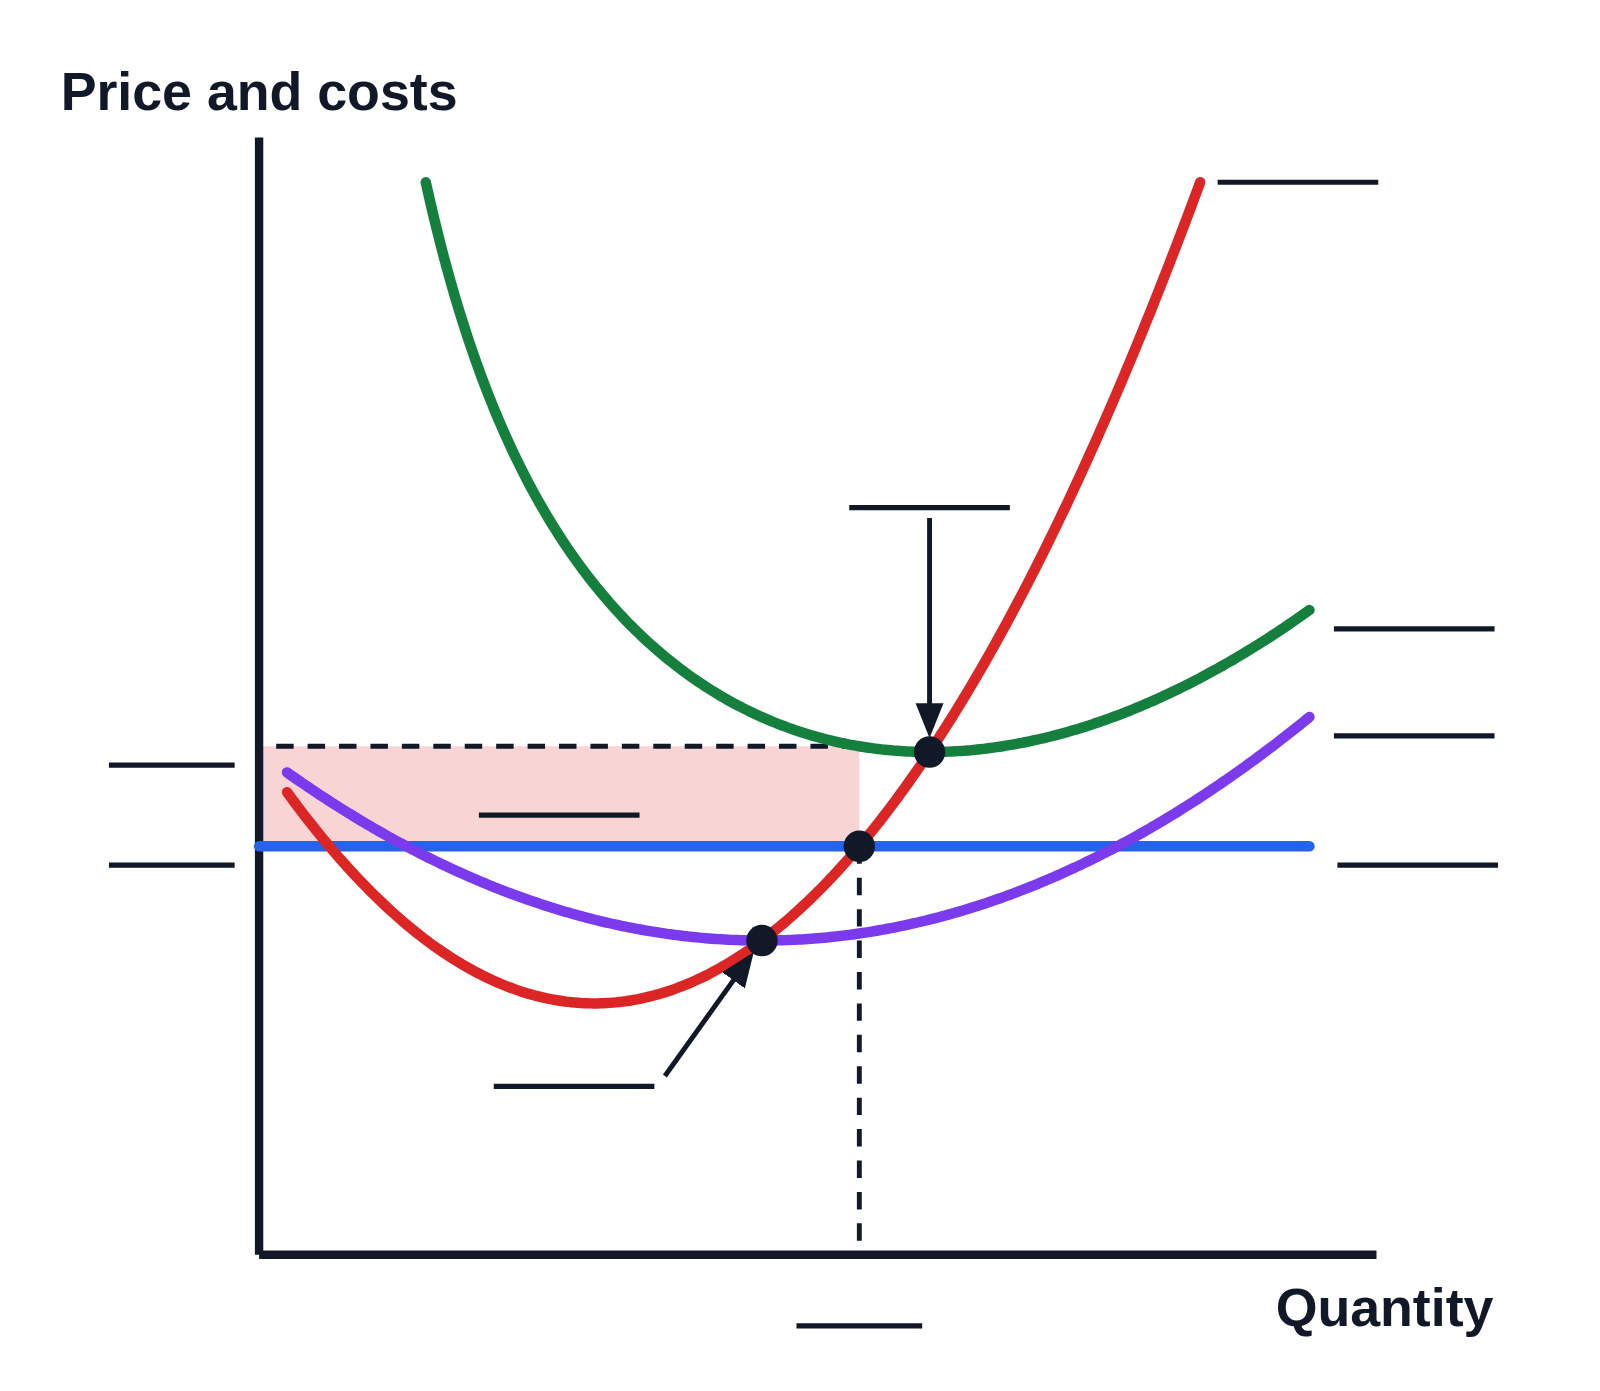 Perfect competition short-run loss graph with blank labels (worksheet)