
Production possibilities curve with efficient, inefficient and unattainable points
An example figure from the Production Possibilities Curve generator.
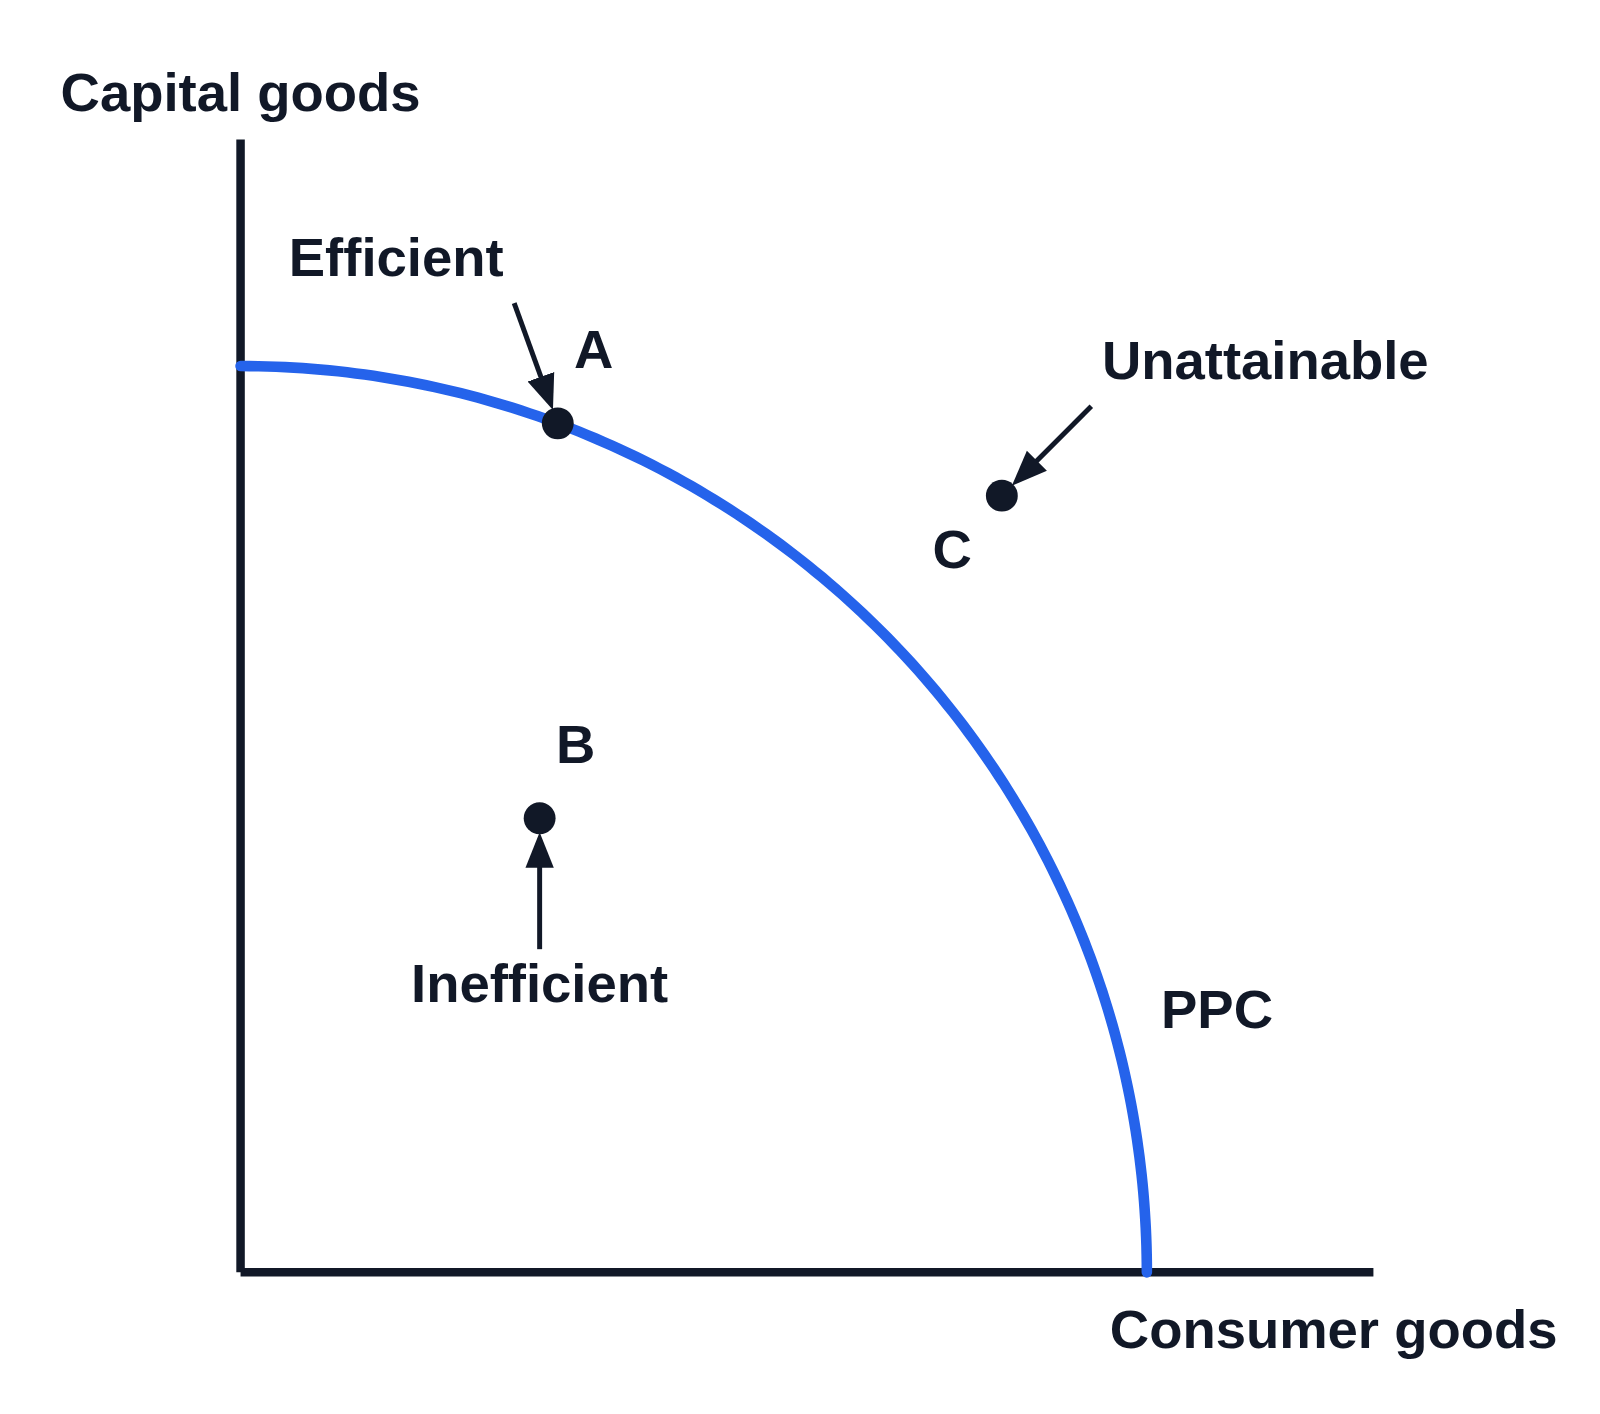
Editing opens it in Production Possibilities Curve with these settings, to change anything and copy or download your own.
Free to use in your tests, worksheets, slides or anything else, no credit needed. Public domain under CC0 1.0. How to reuse our figures
More Production Possibilities Curve examples
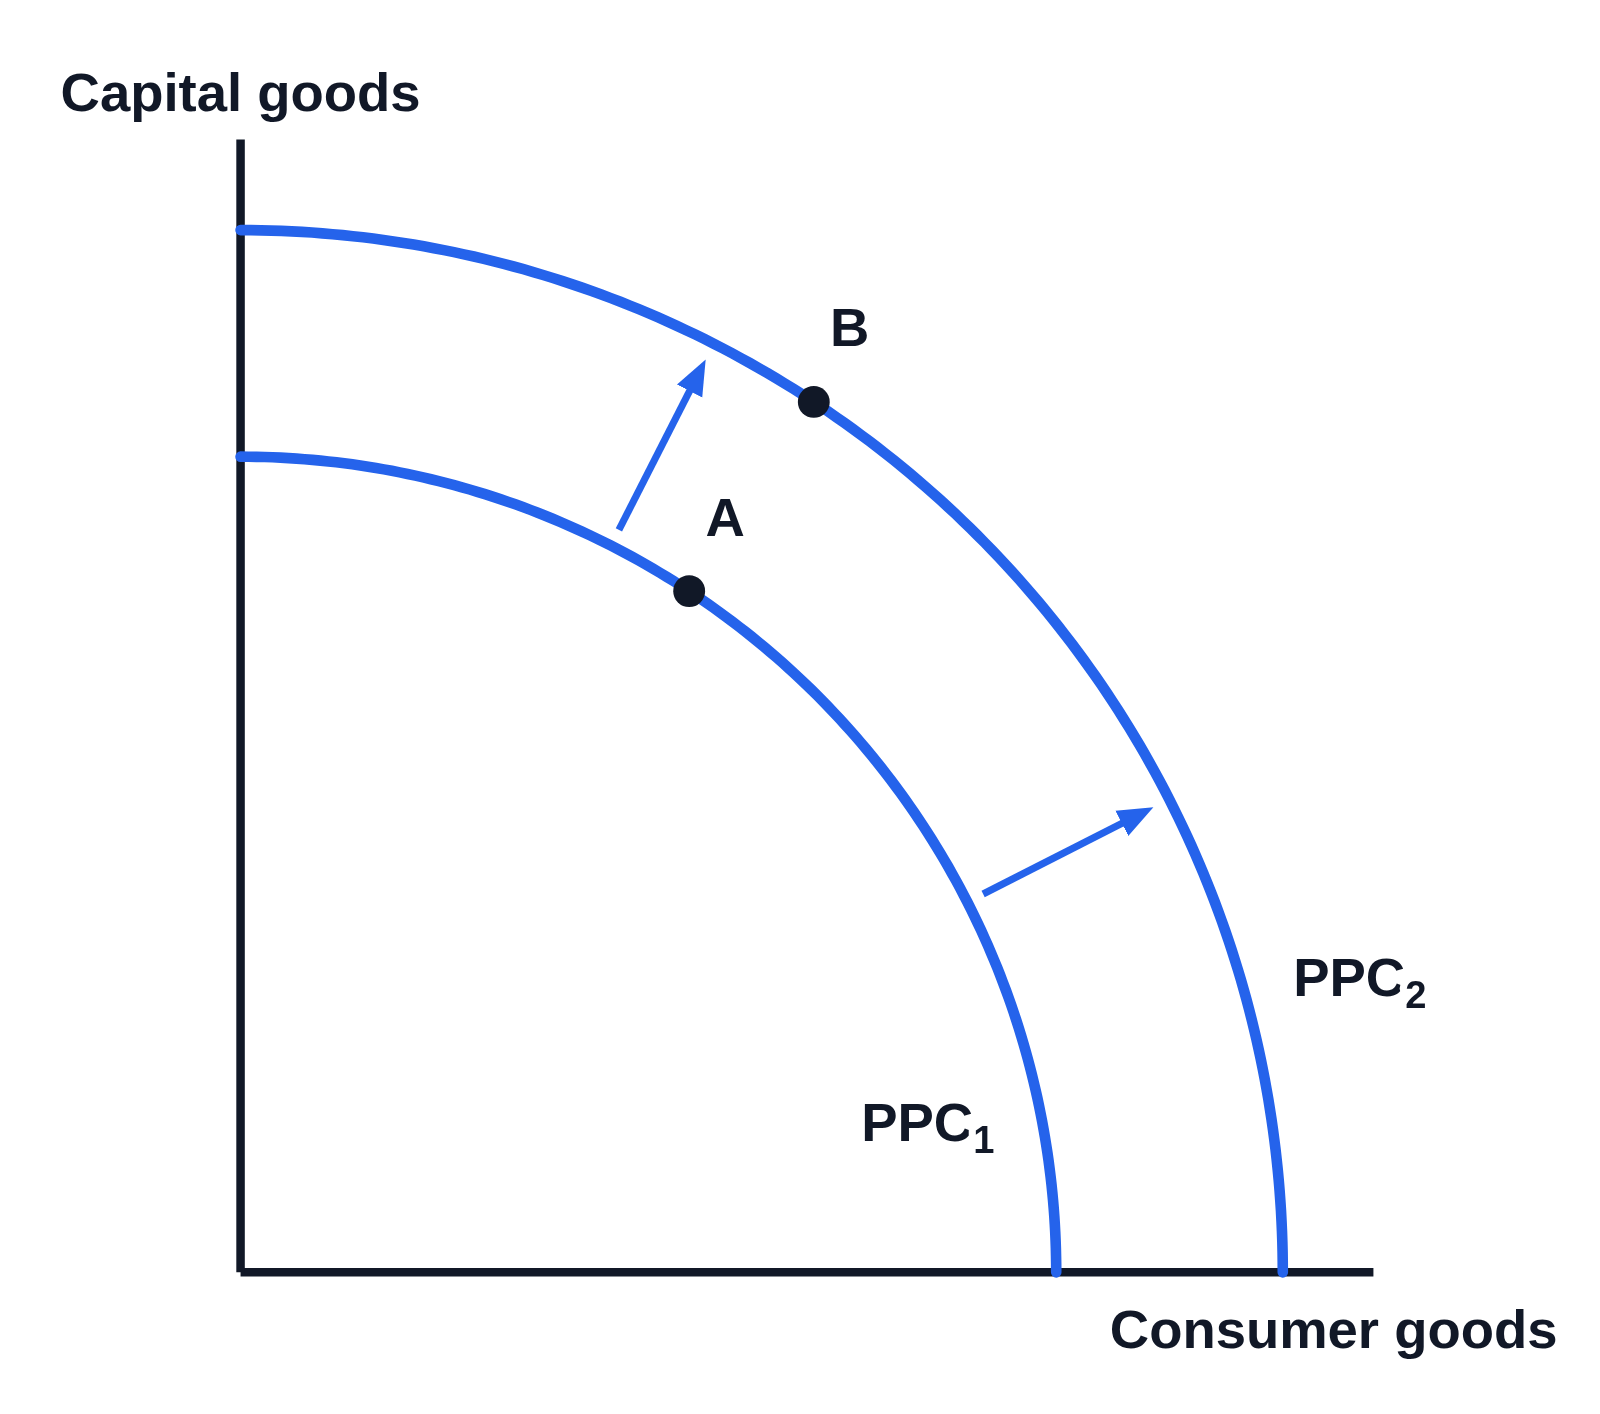 PPC shifting outward: economic growth on a production possibilities curve
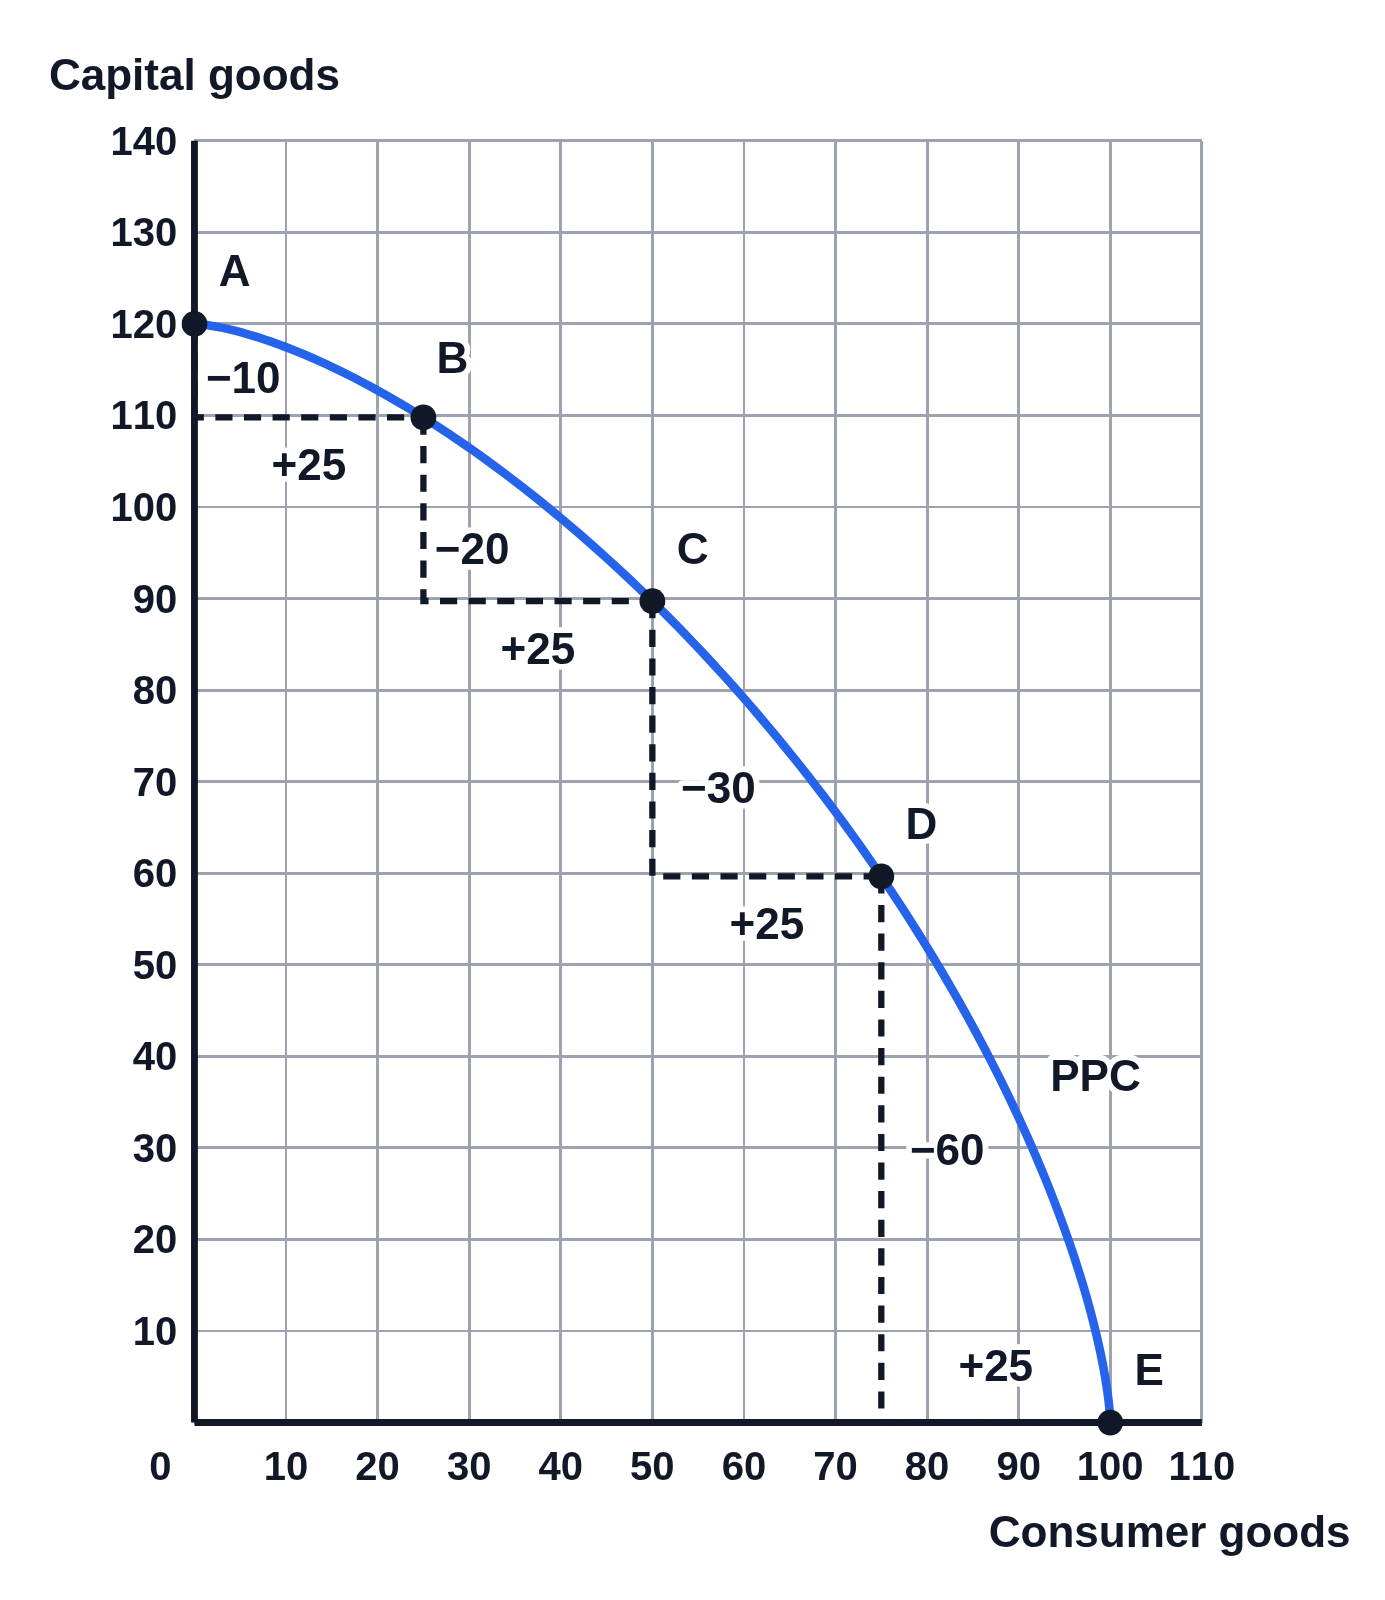 Increasing opportunity cost on a numbered production possibilities curve
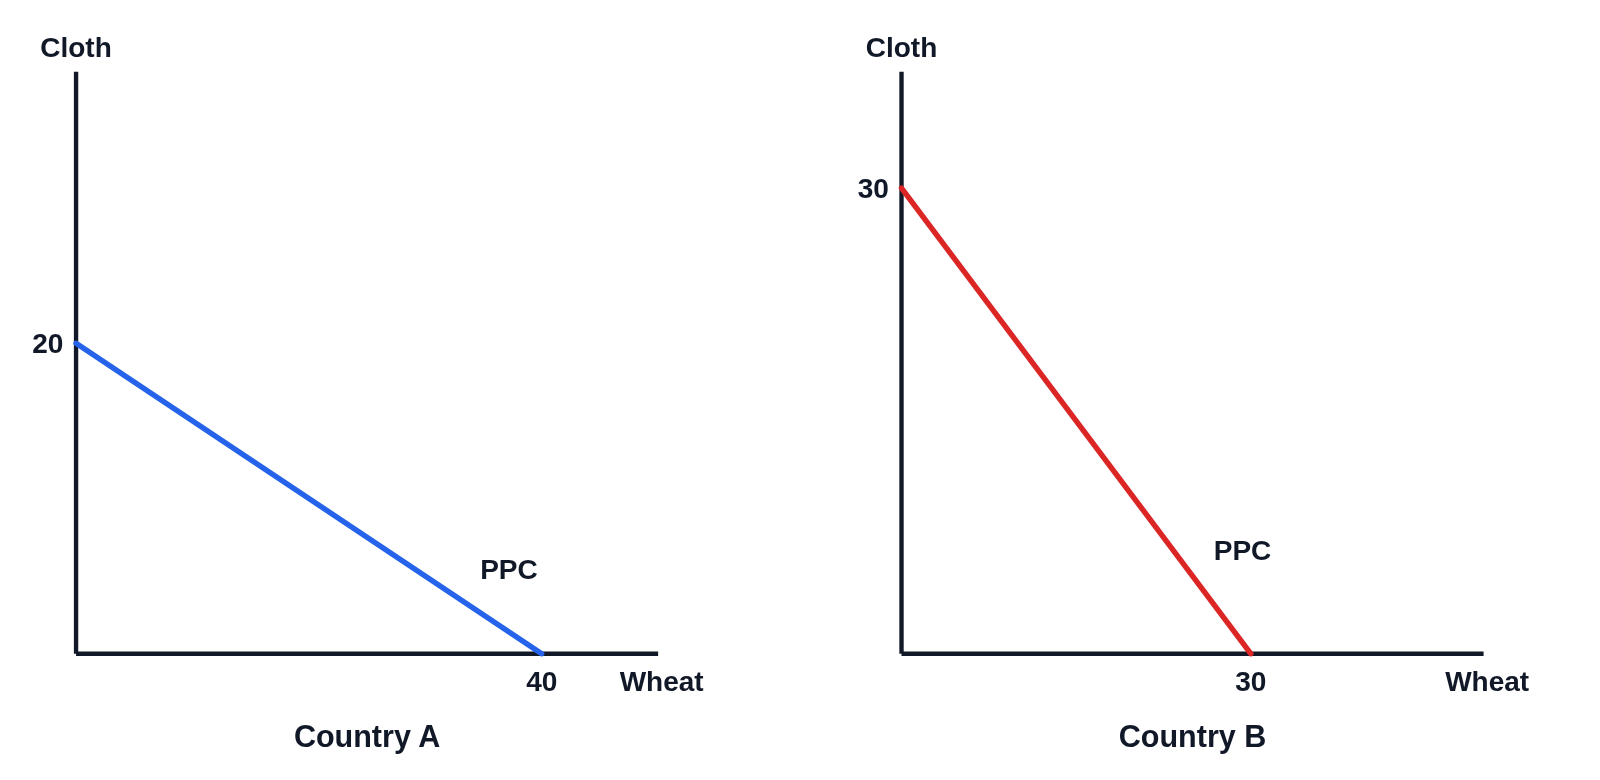 Comparative advantage: two countries’ production possibilities curves side by side
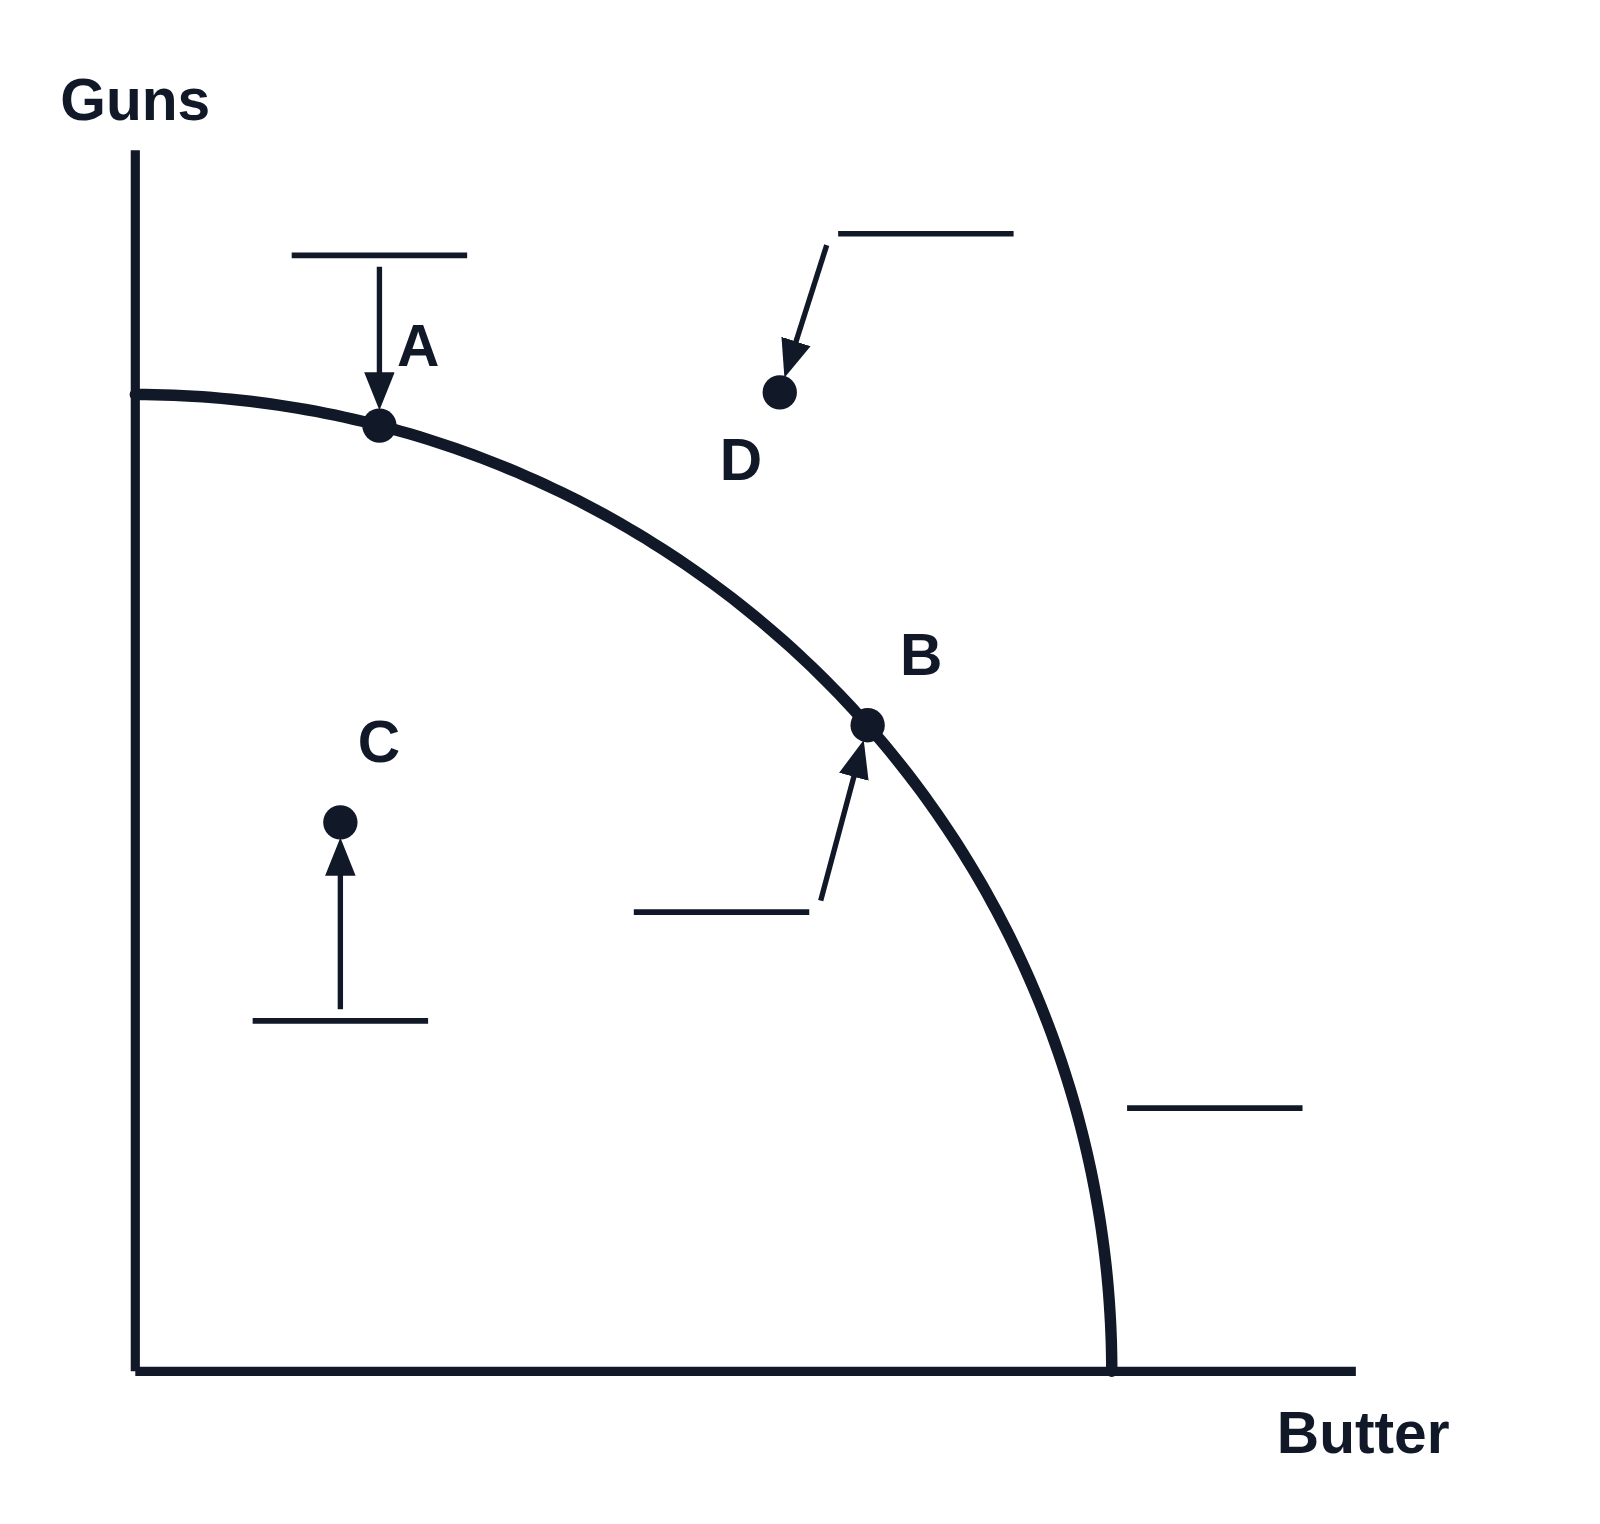 Production possibilities curve worksheet: label the points (guns and butter)