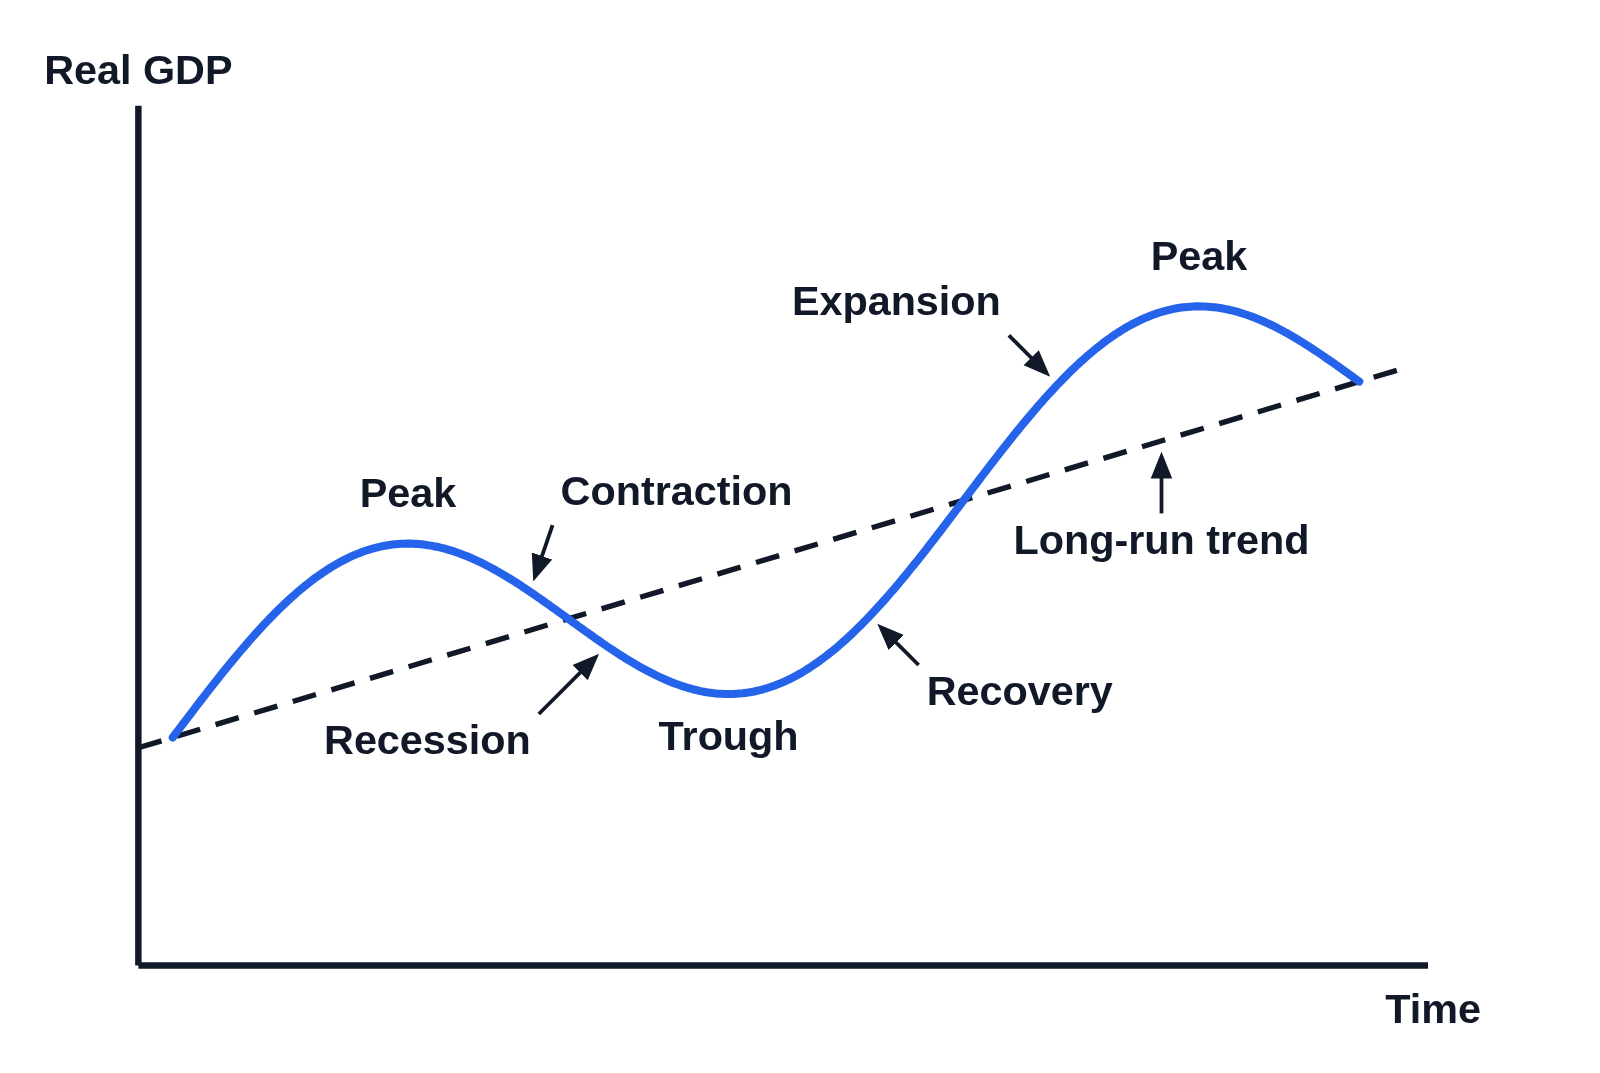
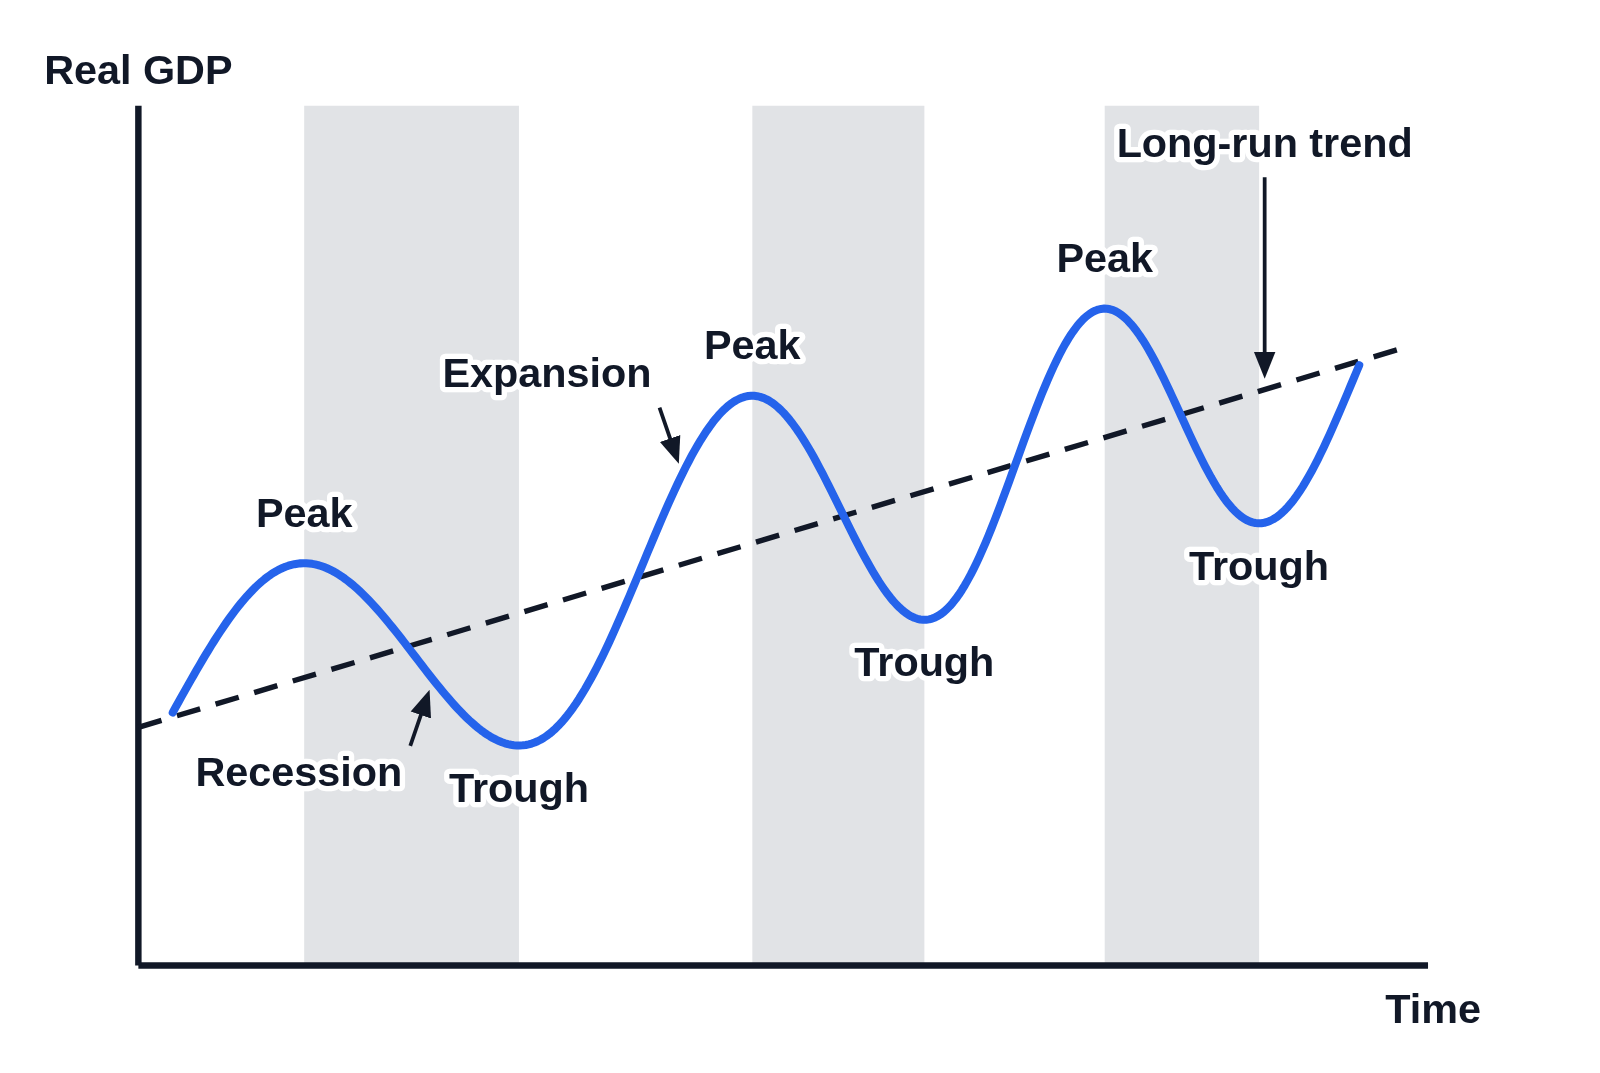
Business cycle graph: peak, trough, expansion and contraction

An example figure from the Business Cycle generator.

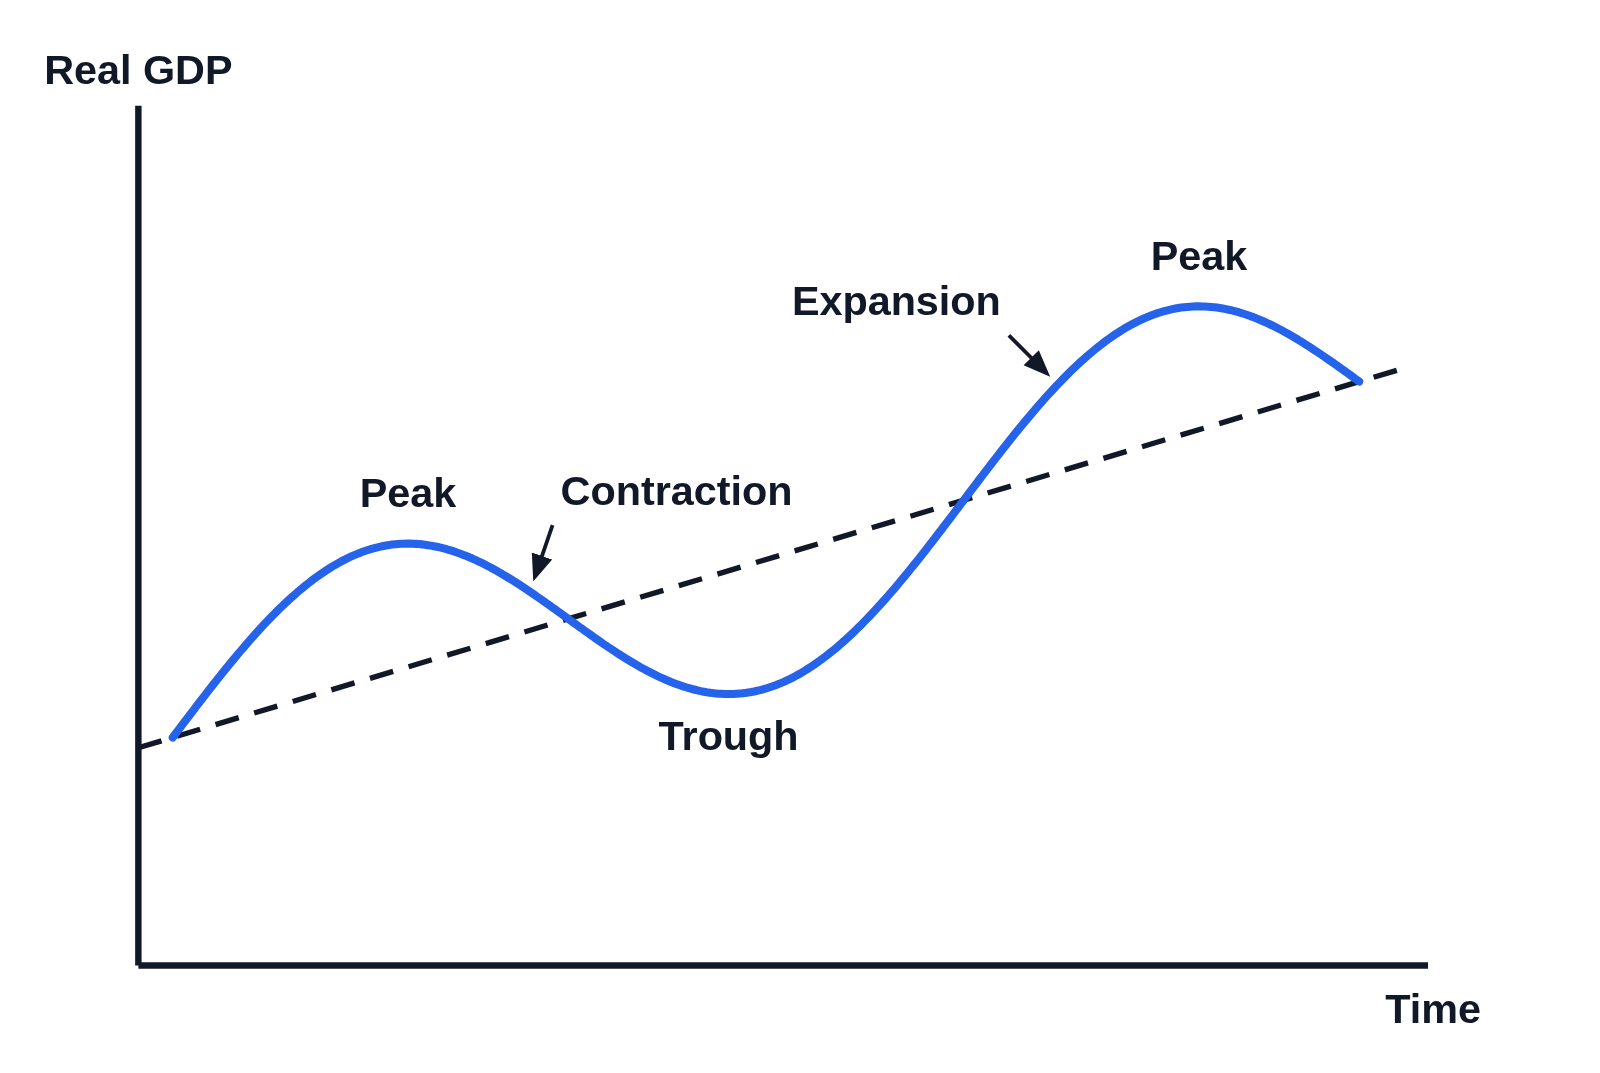
Business cycle graph with Real GDP up the side, Time along the bottom and no numbers on the axes: a blue wave of real GDP rising from a dashed, upward-sloping long-run trend line to a high point labeled Peak, falling to a low point labeled Trough, then rising to a second, higher Peak and turning down, with an arrow to the fall after the first peak labeled Contraction and an arrow to the rise before the second peak labeled Expansion
Real GDP rising and falling over time around a dashed long-run trend that slopes upward, drawn with no numbers on the axes. Real GDP rises to a peak, falls to a trough, then rises to a second, higher peak and turns down again. Arrows label the fall after the first peak Contraction and the rise to the second peak Expansion.

Editing opens it in Business Cycle with these settings, to change anything and copy or download your own.

Free to use in your tests, worksheets, slides or anything else, no credit needed. Public domain under CC0 1.0. How to reuse our figures

More Business Cycle examples