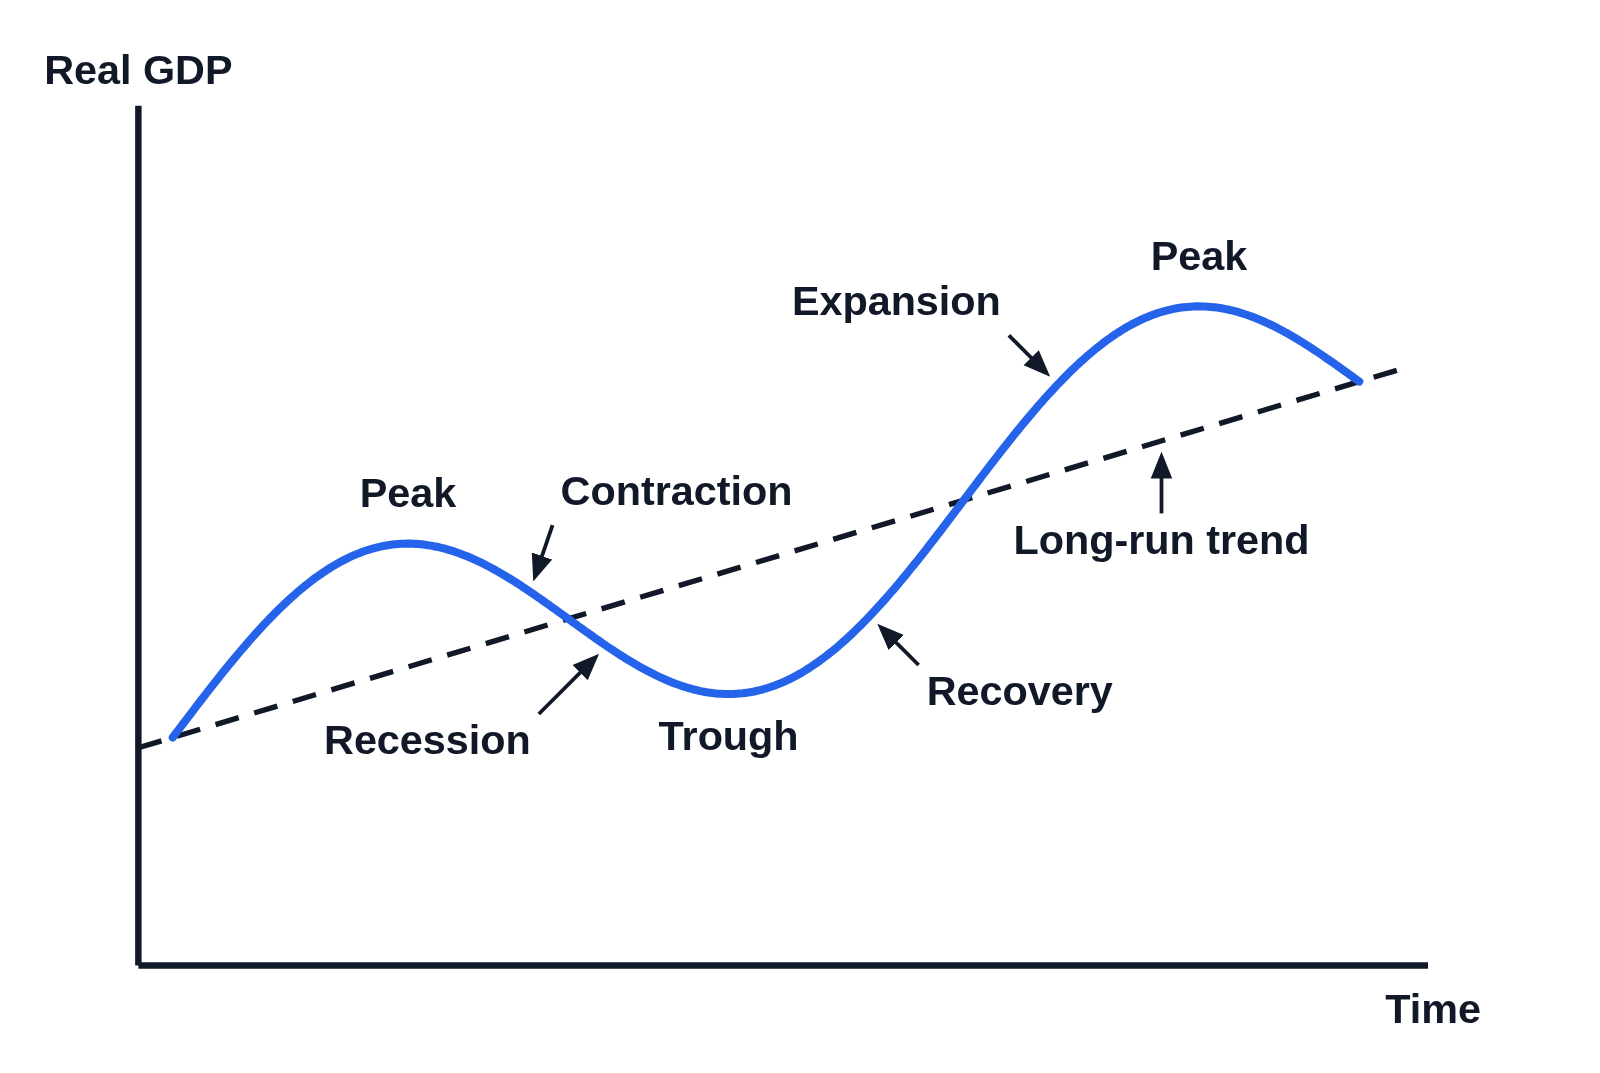
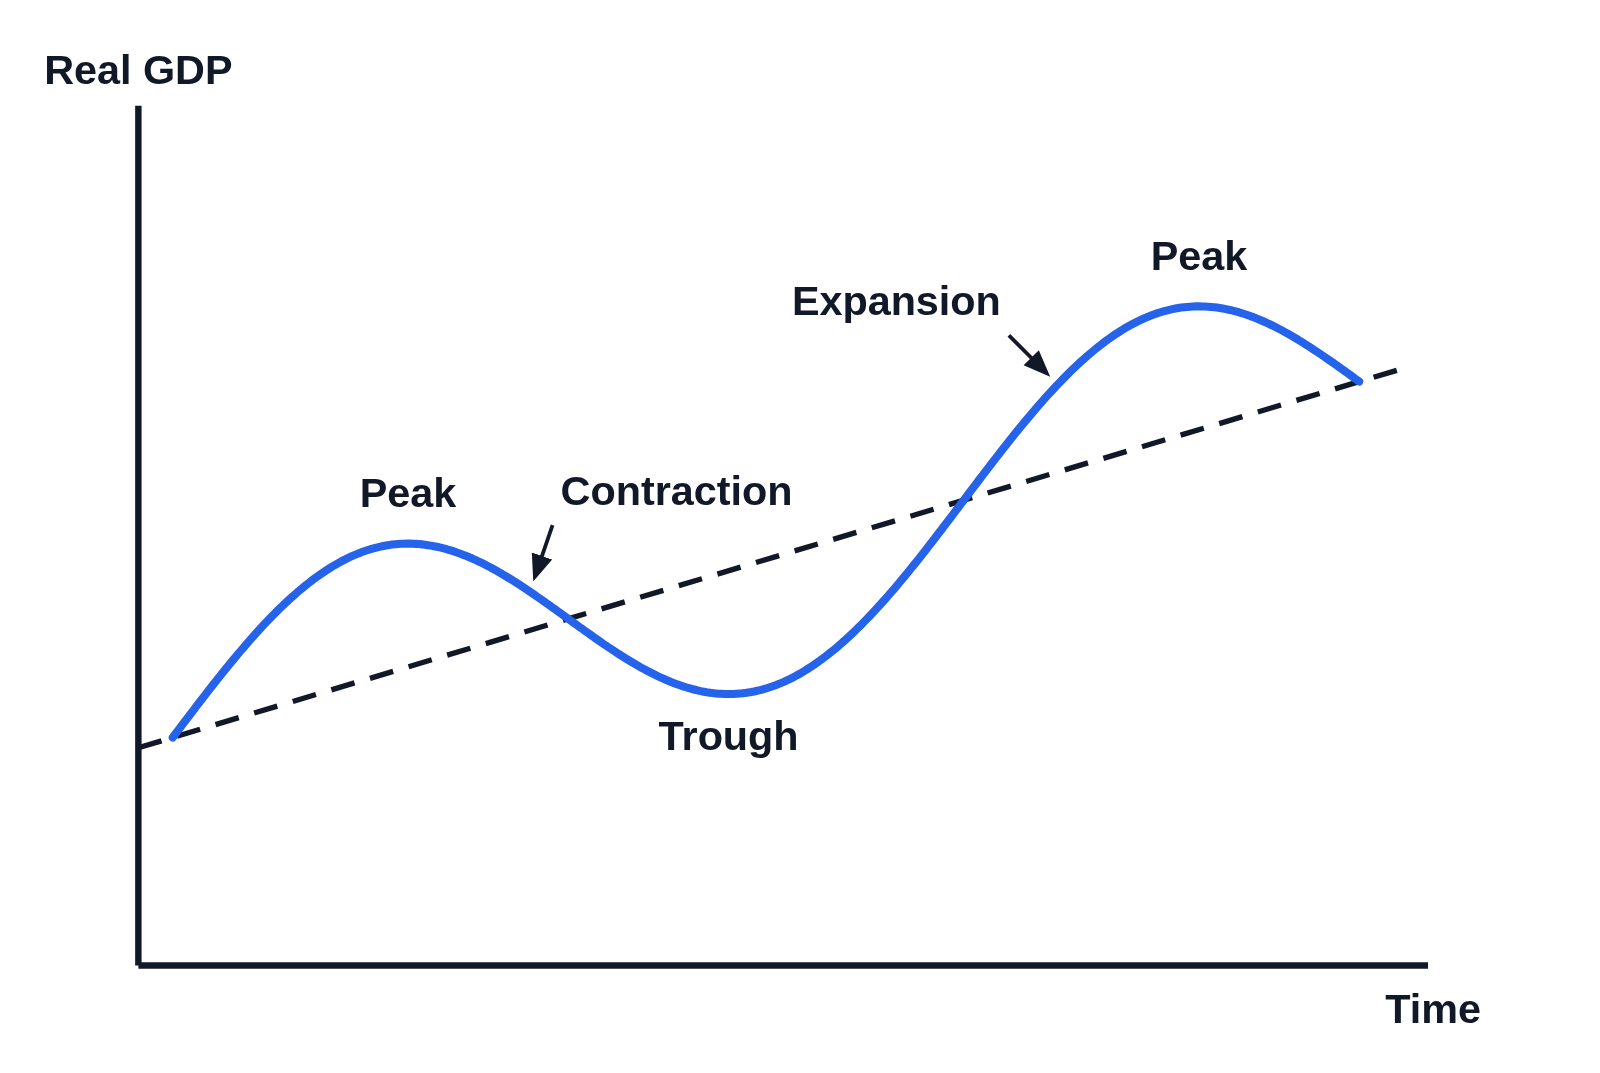
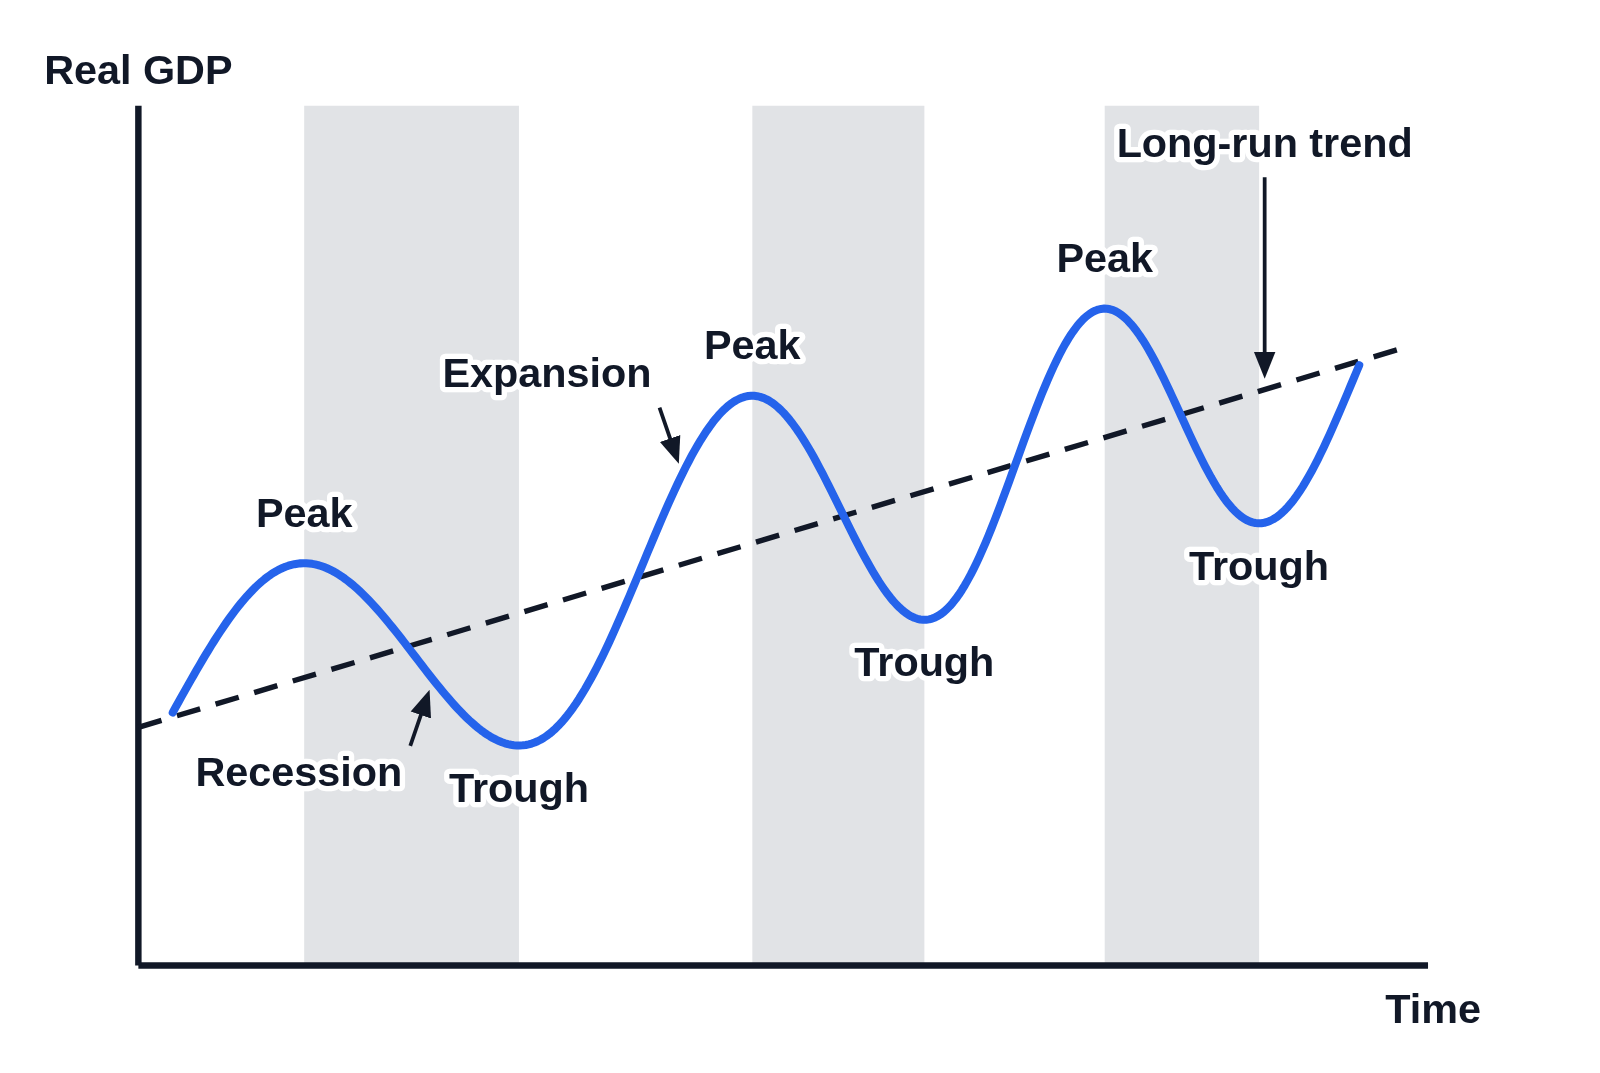
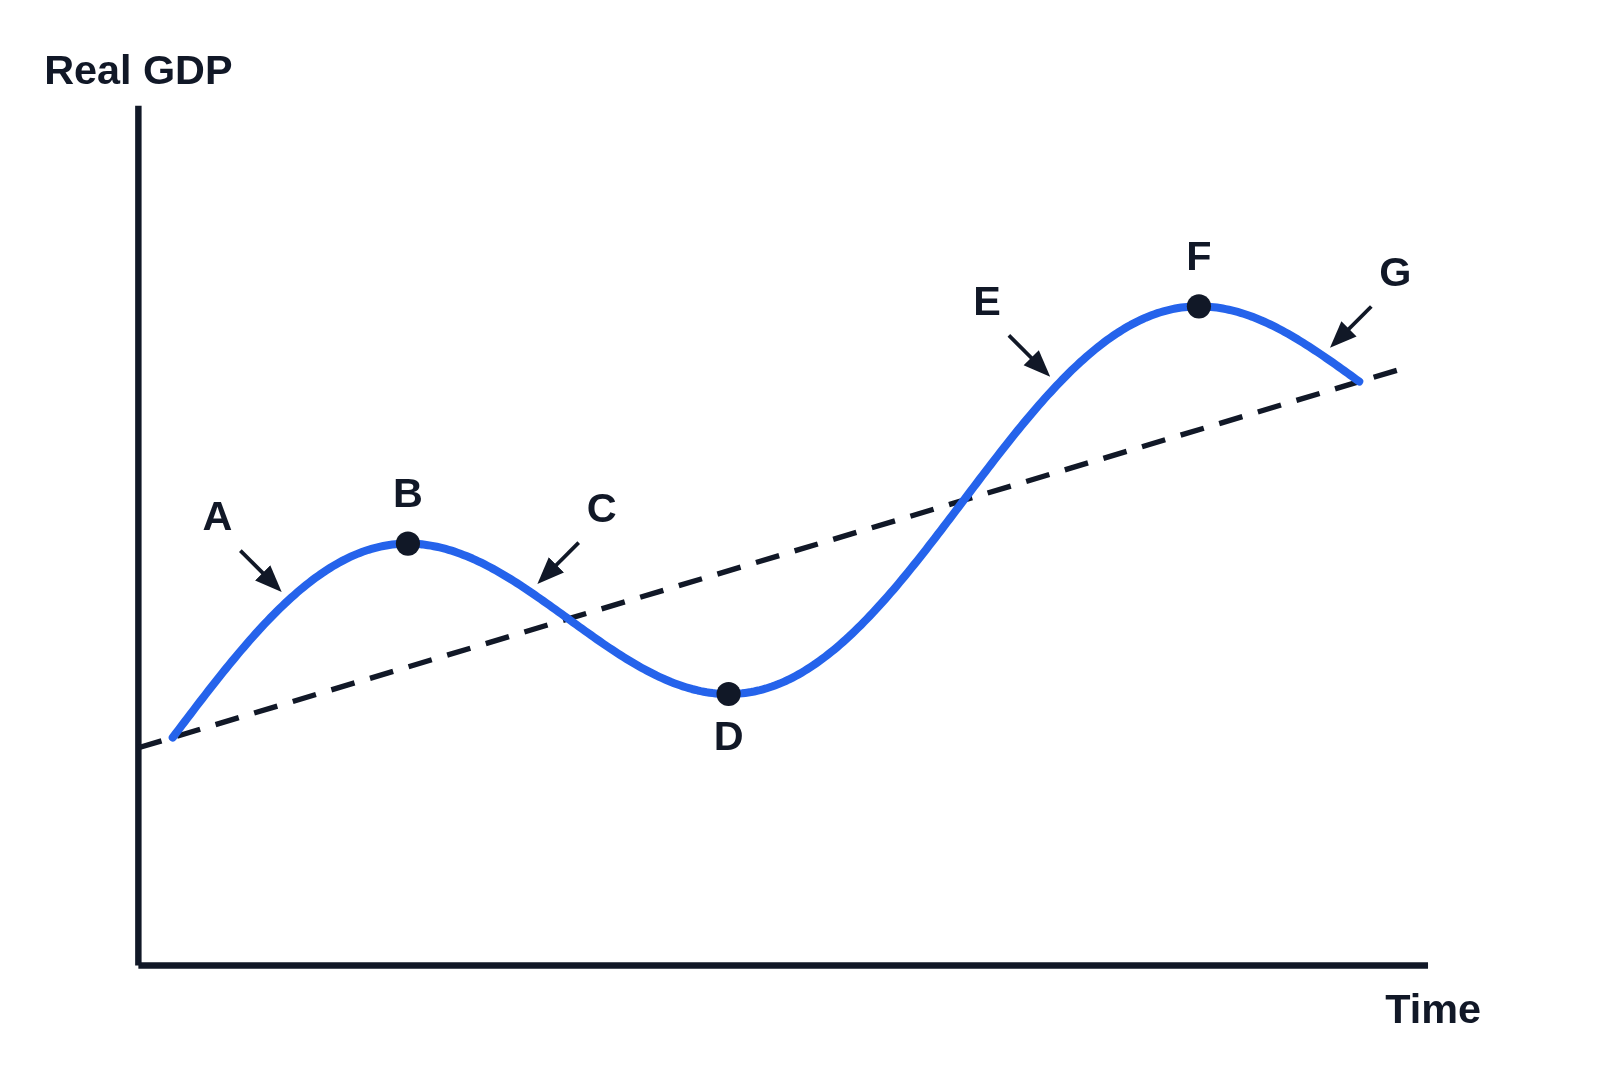
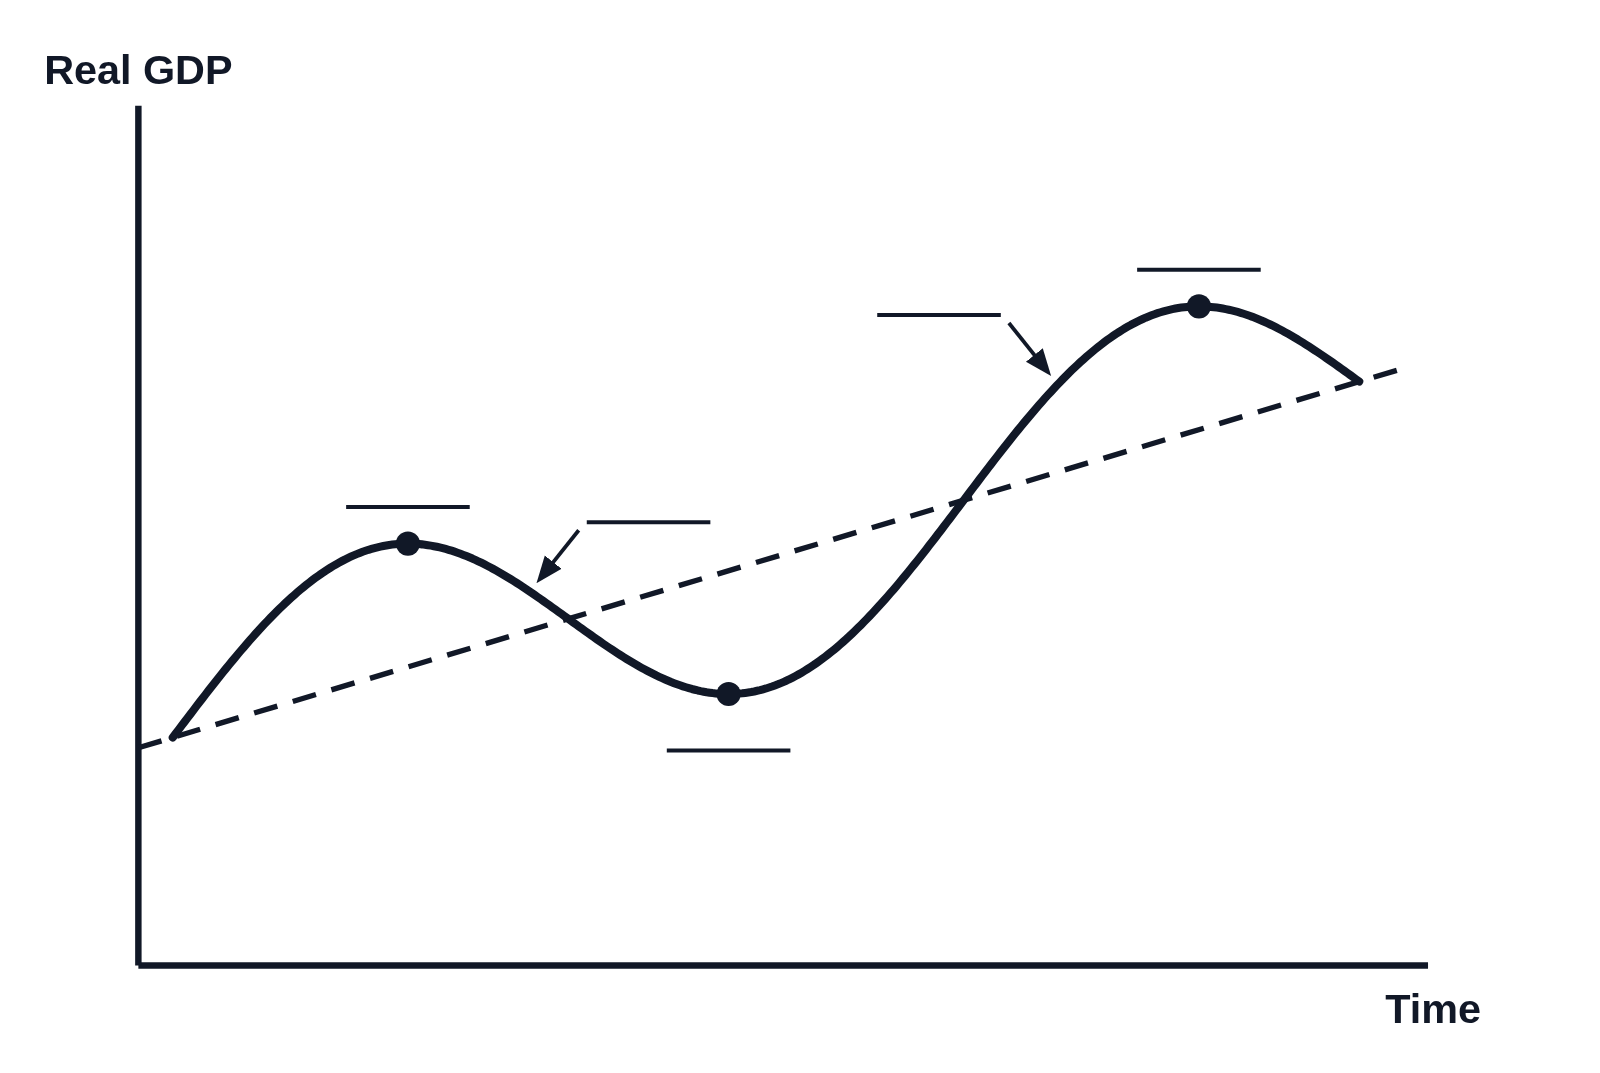
Every term of the business cycle on one graph of real GDP over time. Real GDP rises to a peak, falls to a trough and rises to a second, higher peak, around a dashed line labeled Long-run trend. The fall is labeled both Contraction, from above, and Recession, from below, two names for the same phase, and the rise is labeled Recovery just after the trough and Expansion nearer the second peak.