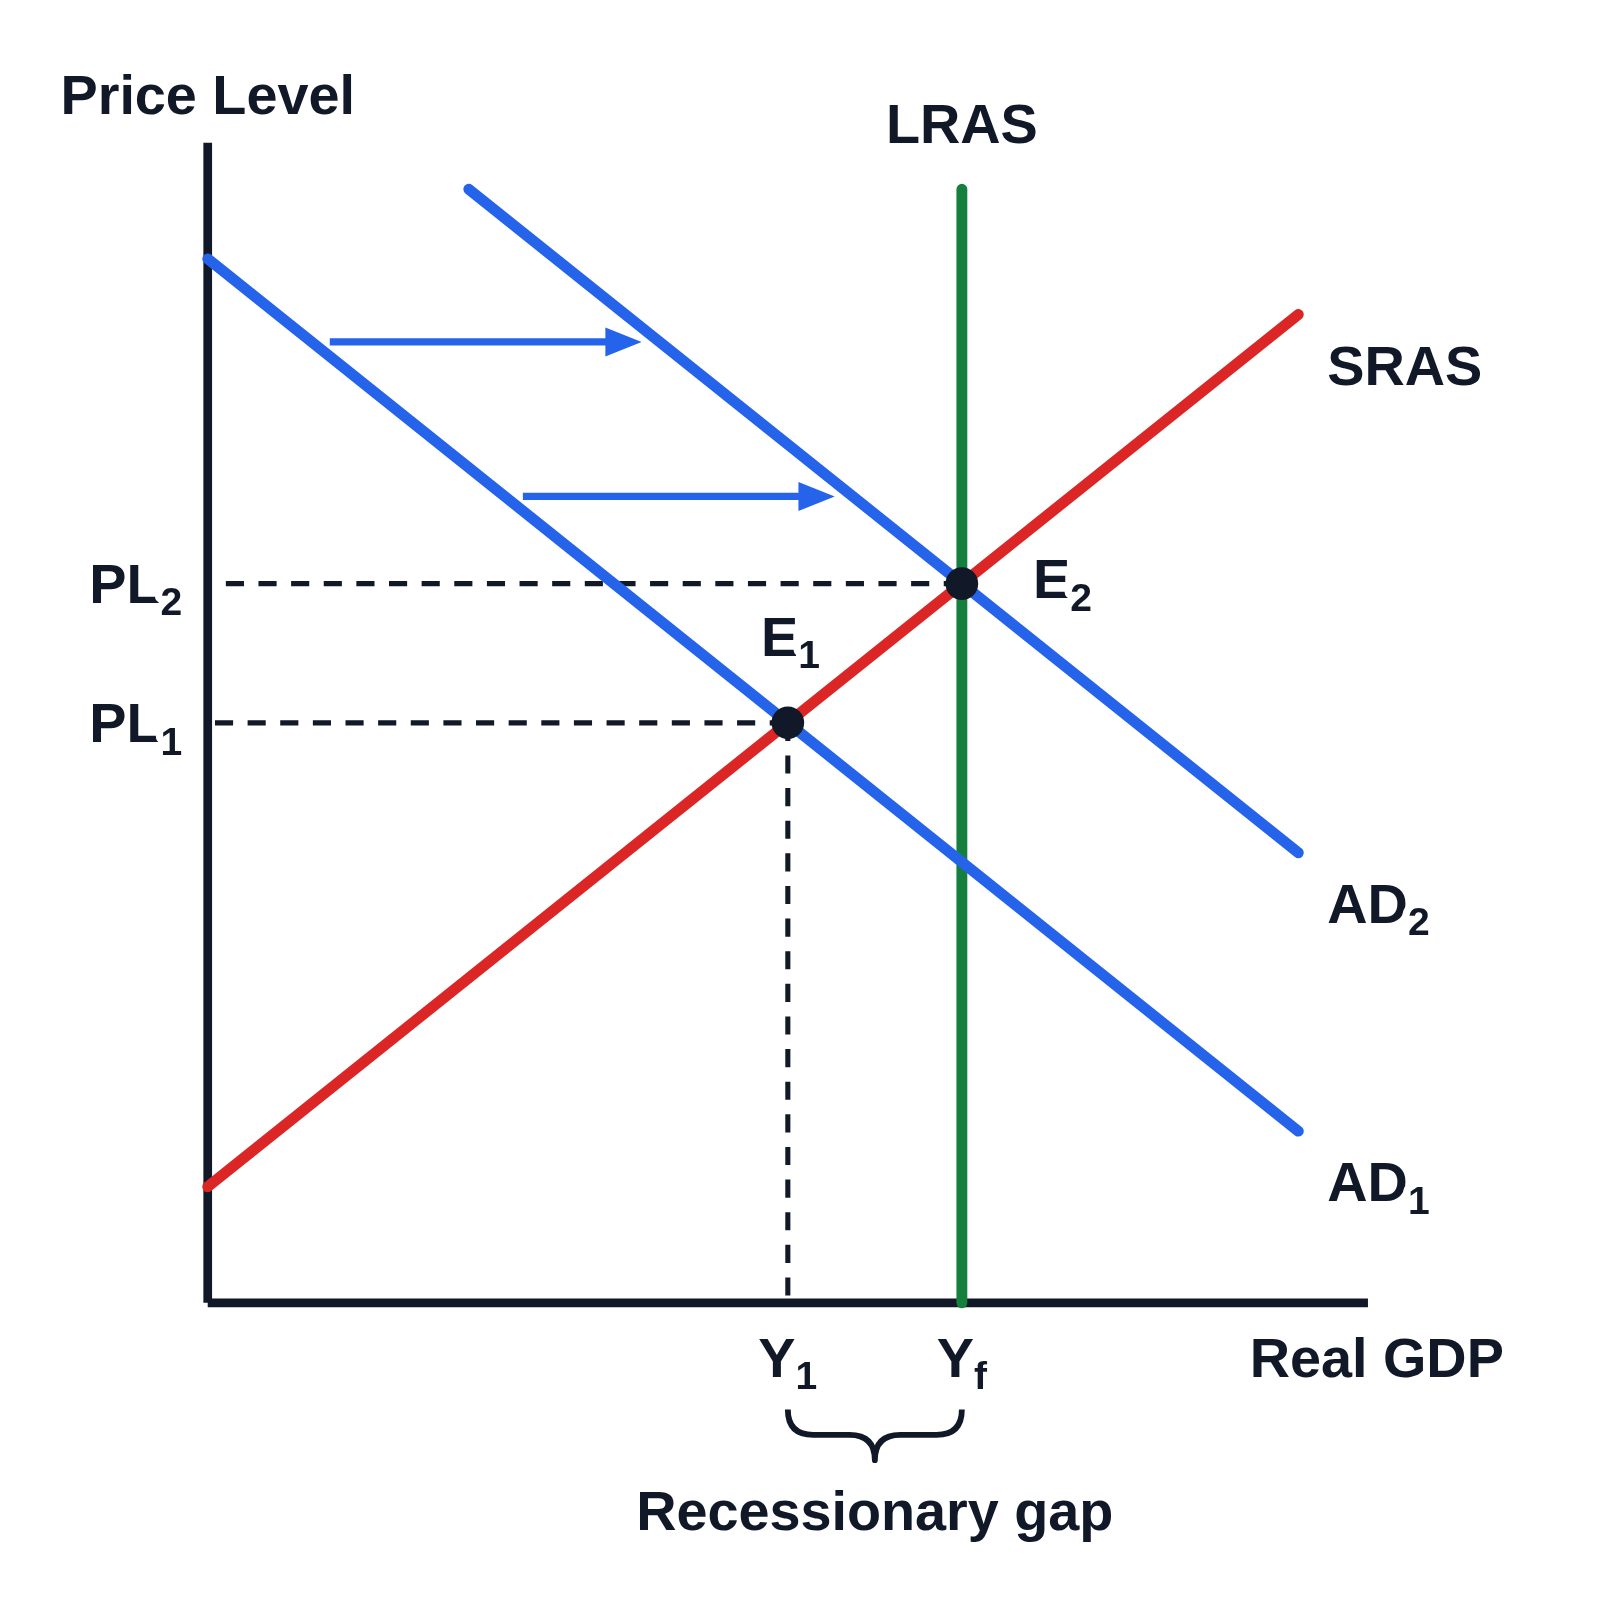
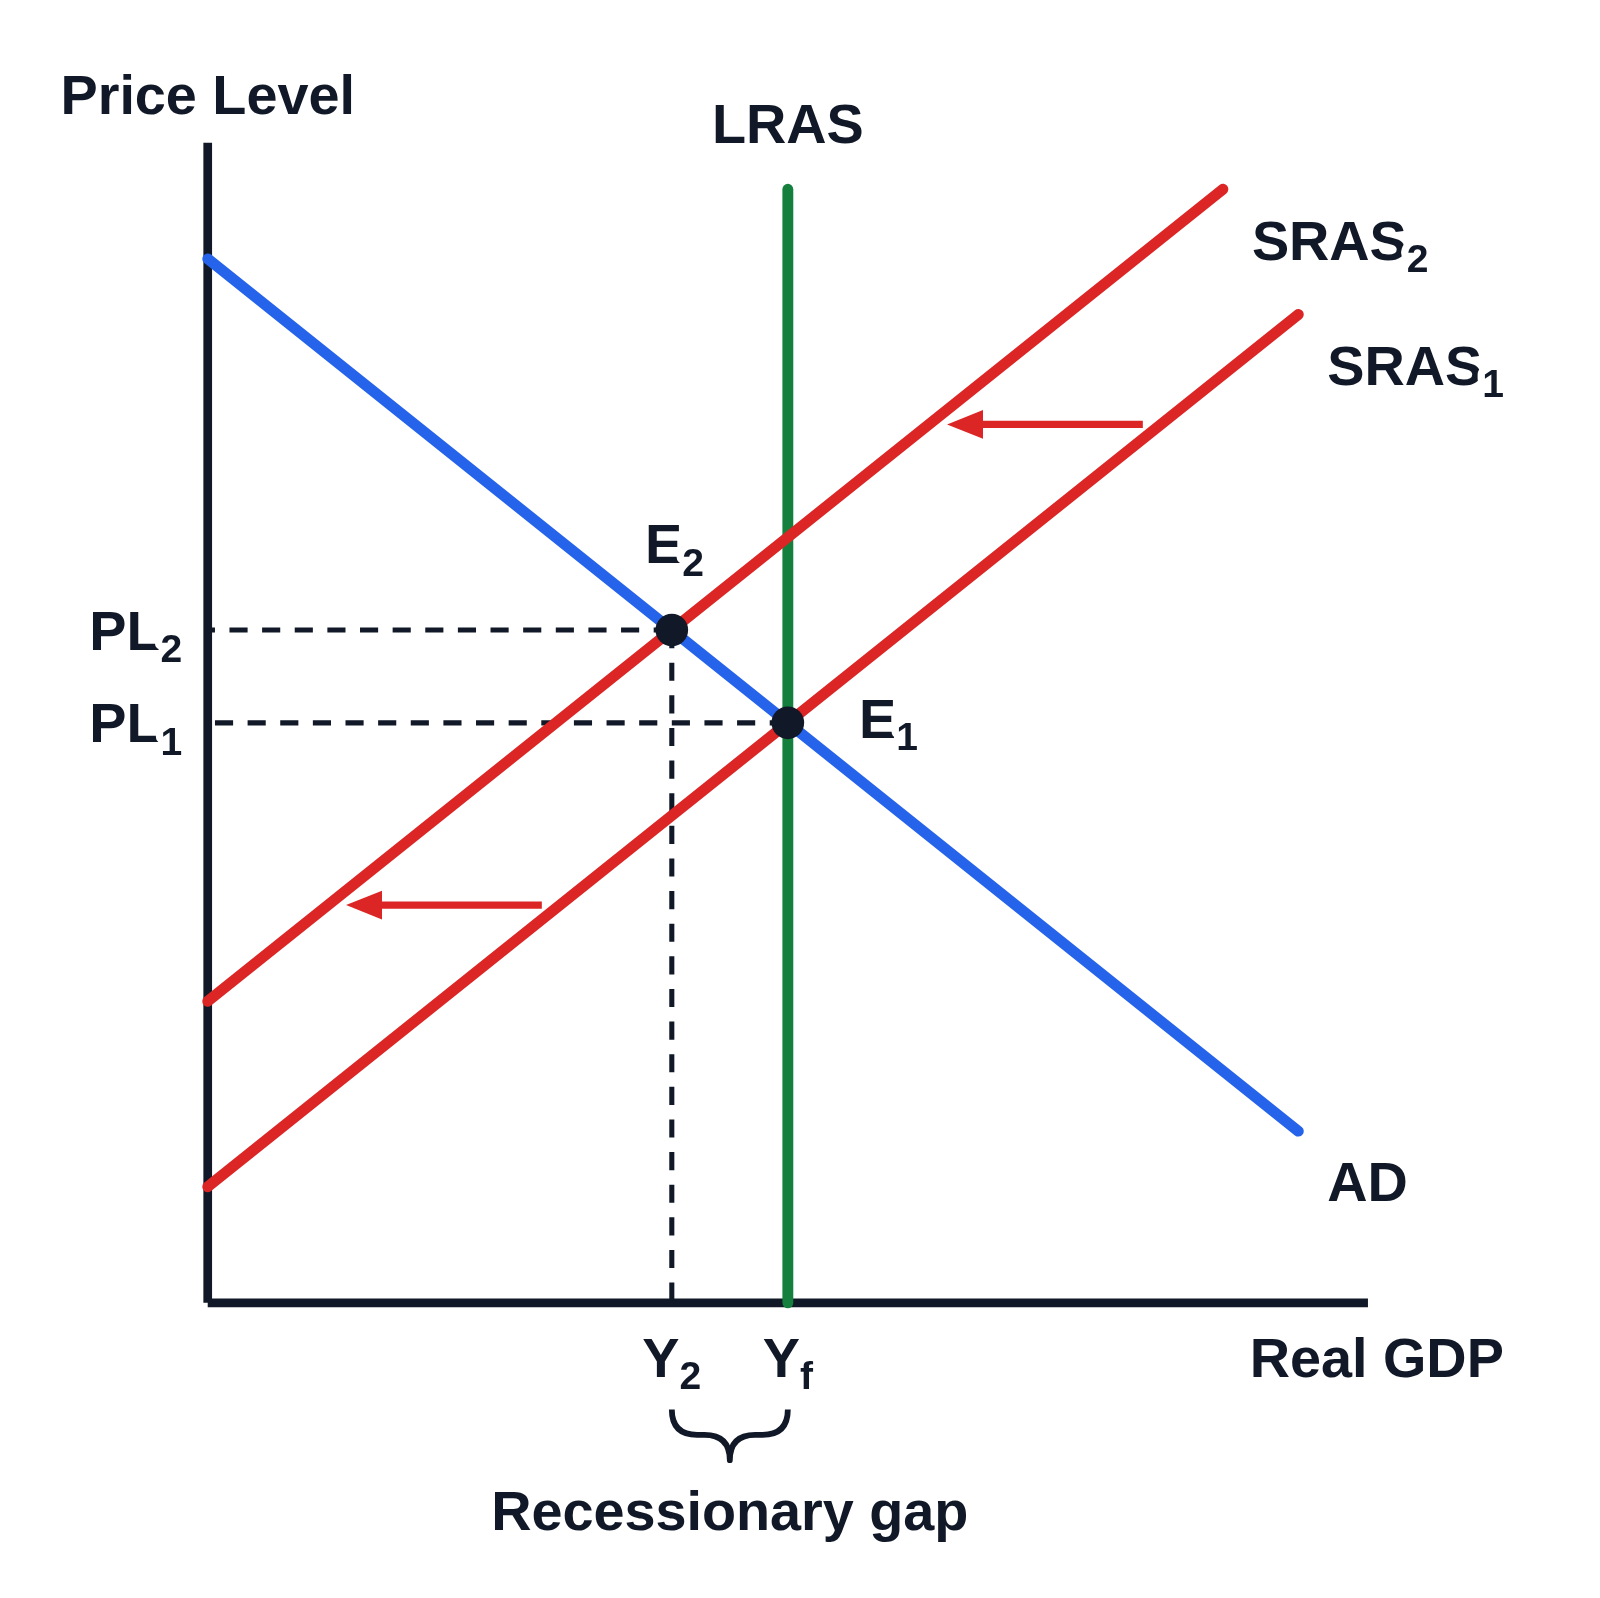
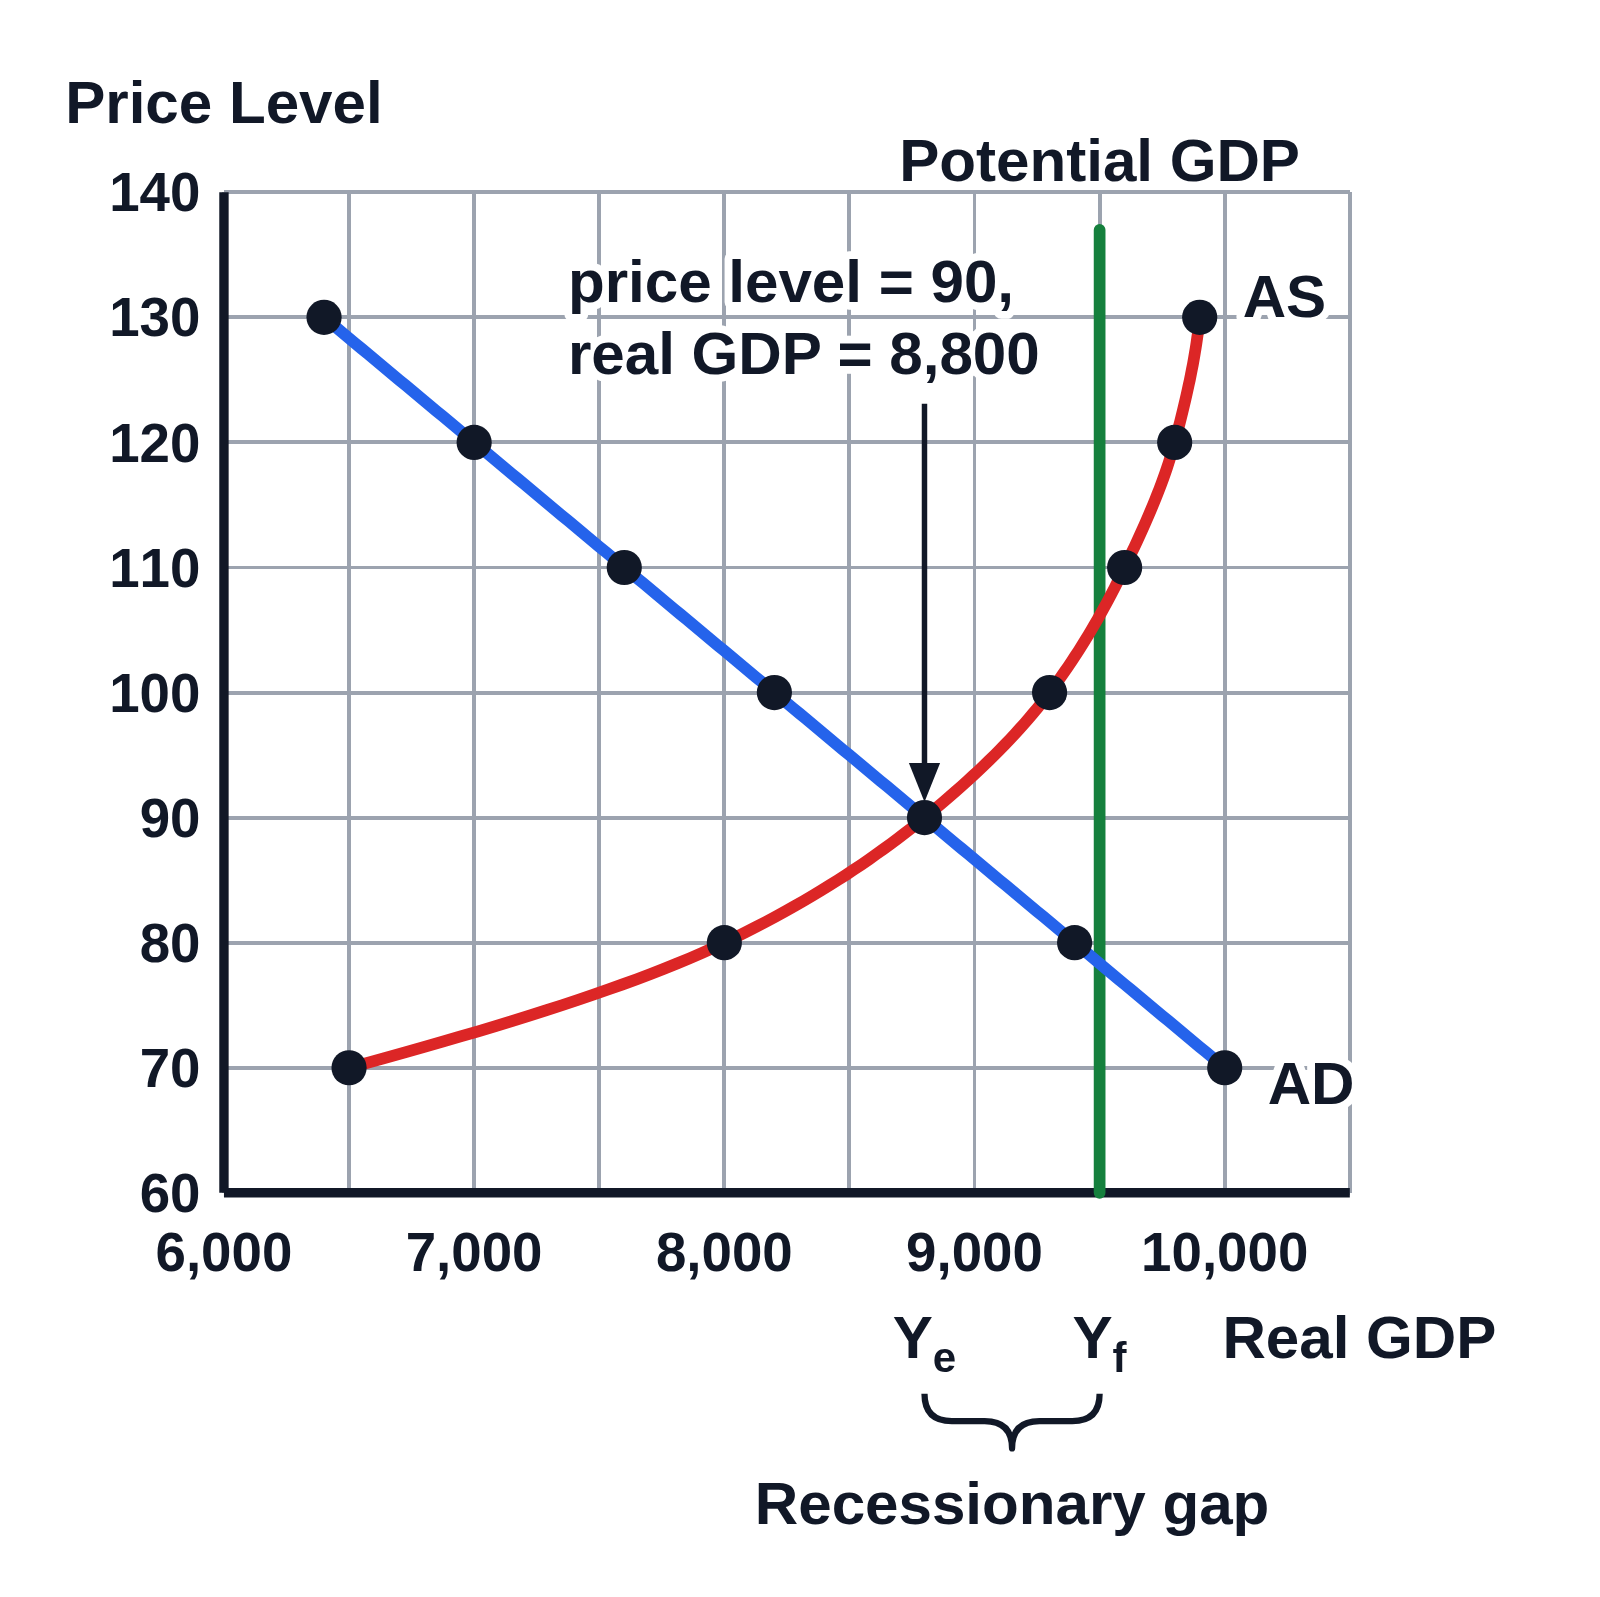
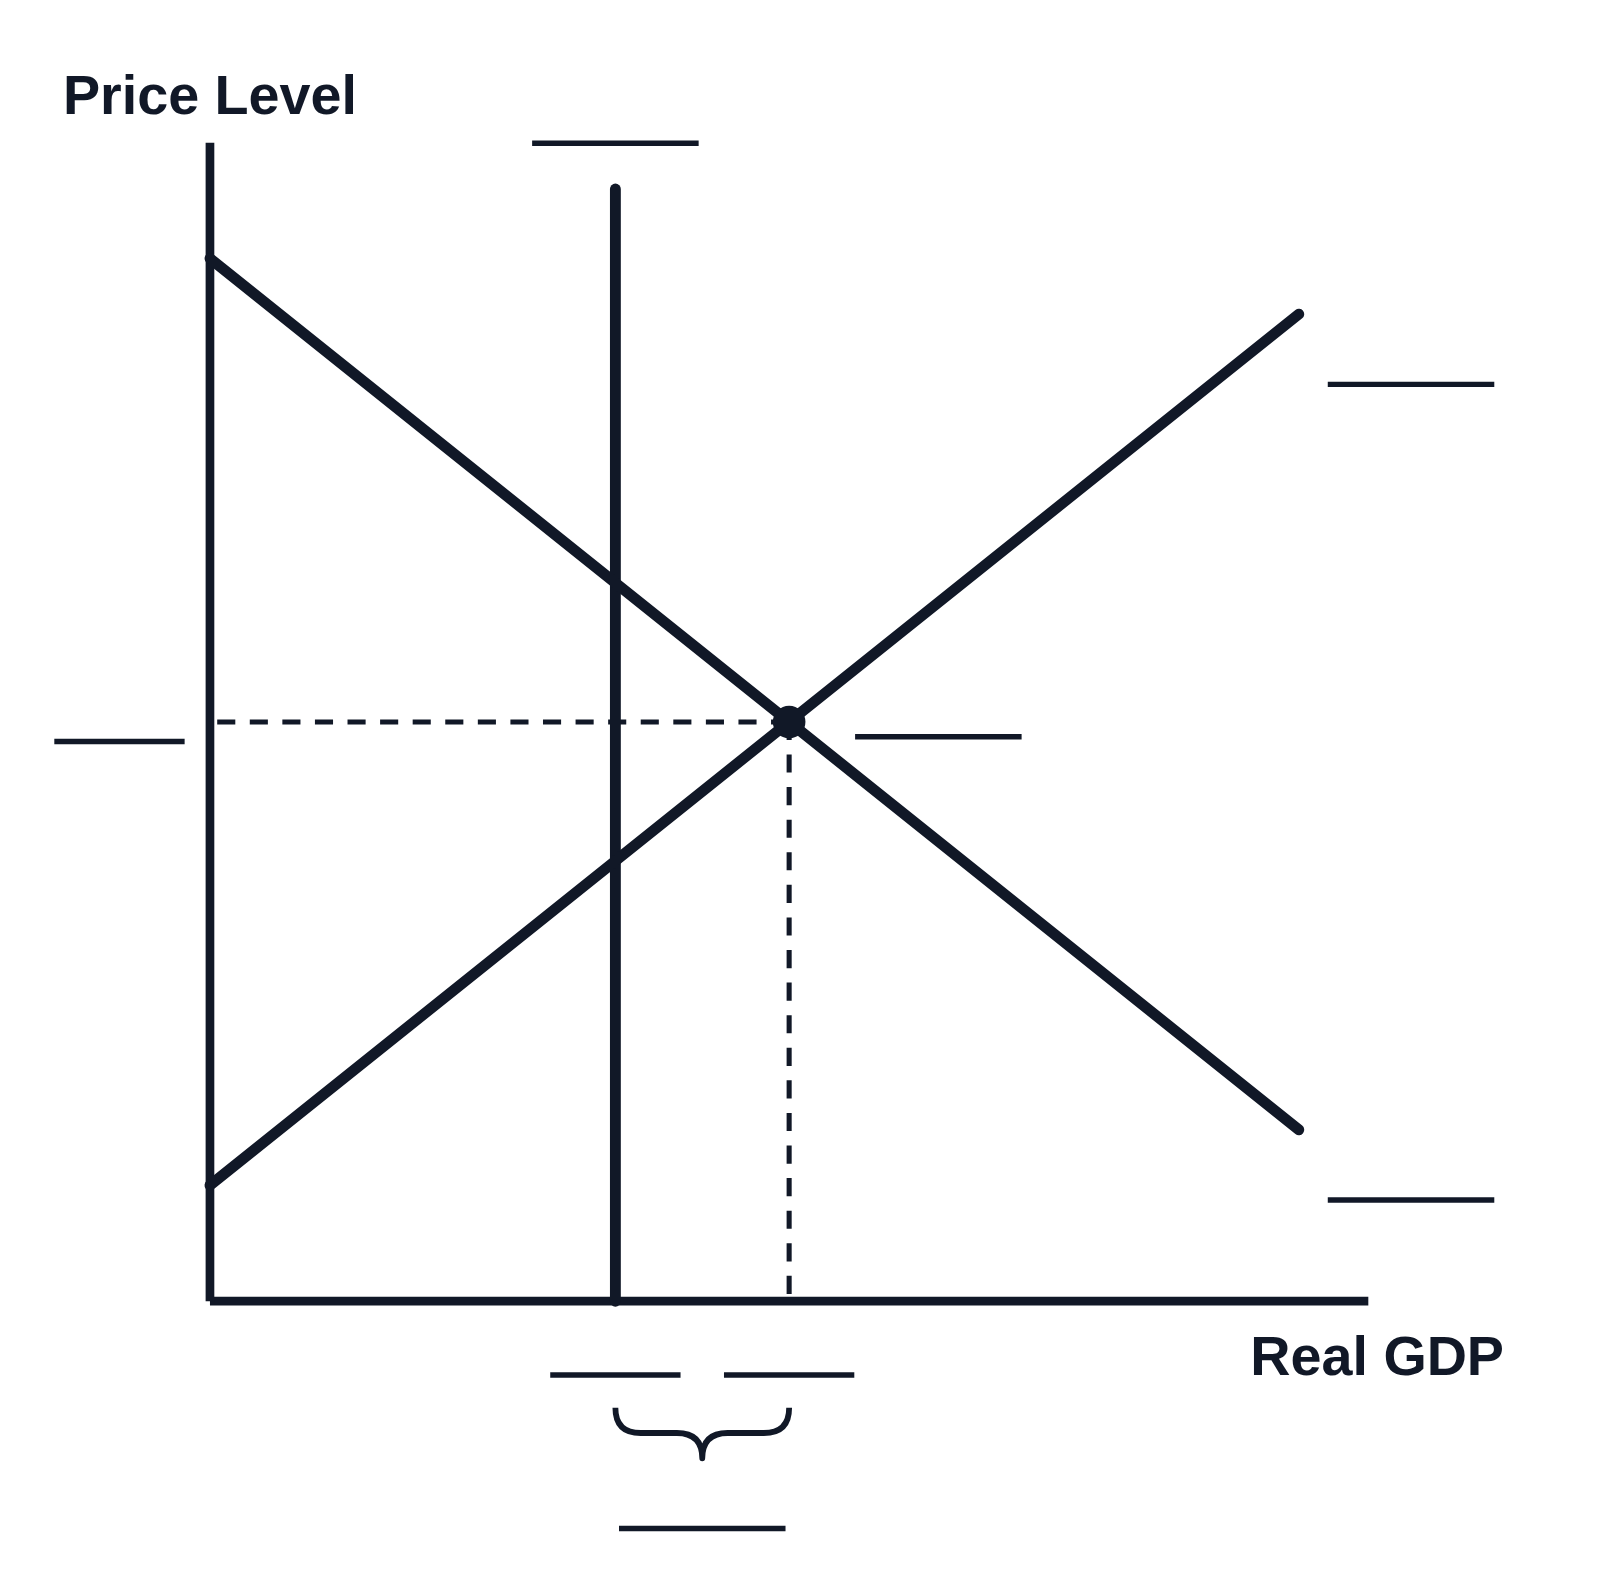
Long-run self-adjustment from a recessionary gap on the AD–AS graph (SRAS shifts right)

An example figure from the AD–AS Model generator.

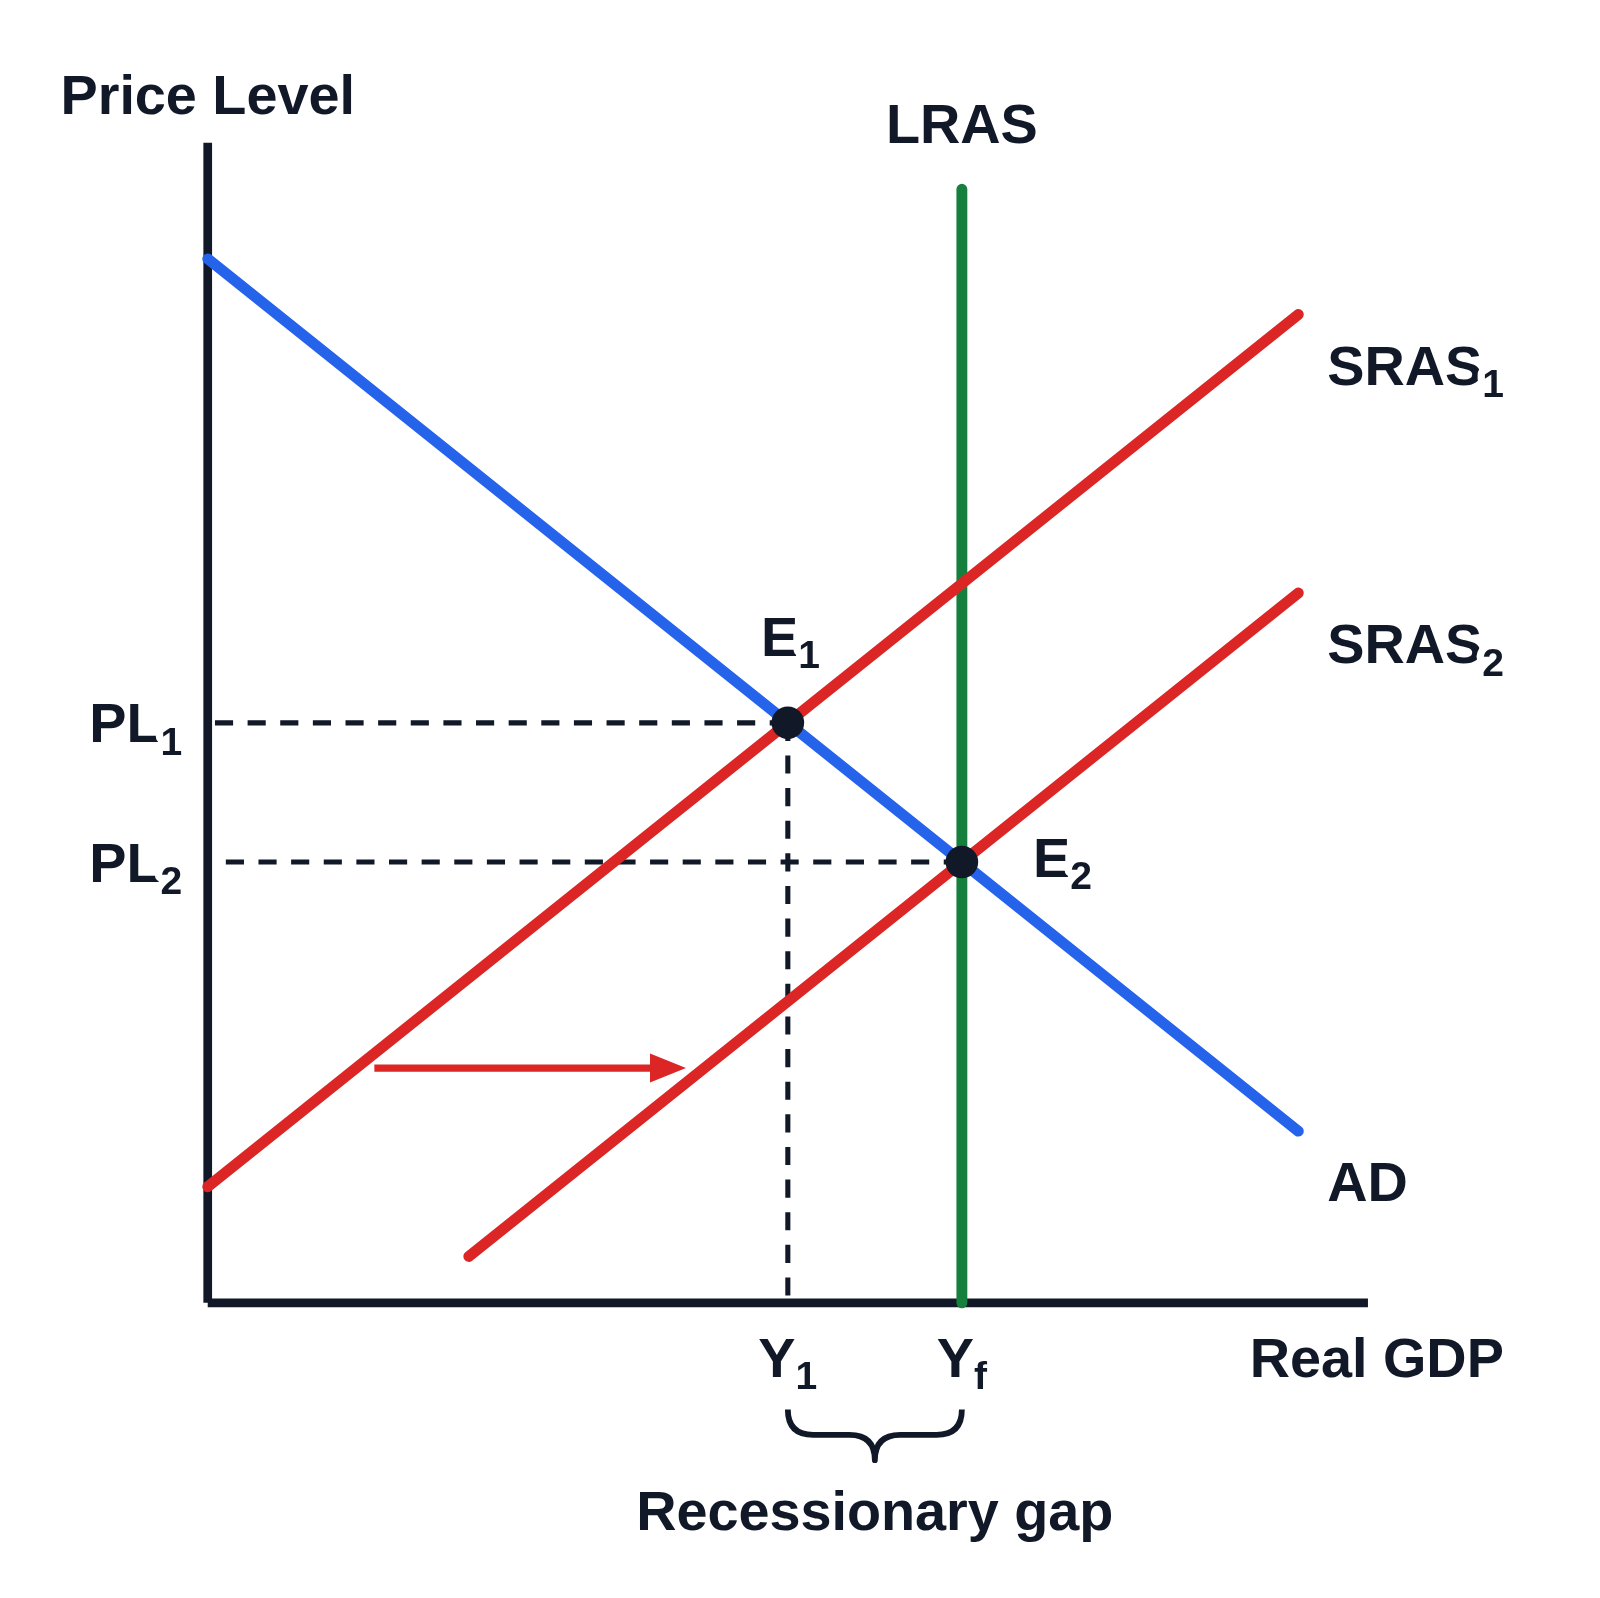
AD–AS graph of price level against real GDP with no numbers on the axes: a downward-sloping blue AD line, a vertical green LRAS line, and a red SRAS₁ line crossing AD at a dot labeled E₁, to the left of LRAS; an arrow points right to SRAS₂, which crosses AD lower down on LRAS at a dot labeled E₂. Dashed lines run from E₁ to both axes and from E₂ to the price level axis, marked PL₁ and the lower PL₂ on the price level axis and Y₁ and Yf on the real GDP axis, and a brace under the axis from Y₁ to Yf is labeled Recessionary gap
An economy returning on its own from a recessionary gap to full employment, with aggregate demand unchanged, drawn with no numbers. AD and SRAS₁ cross at E₁, at real GDP Y₁, short of full-employment output Yf where LRAS stands, and the gap is braced under the axis. SRAS shifts right to SRAS₂, which crosses AD on LRAS at E₂: real GDP rises to Yf and the price level falls from PL₁ to PL₂.

Editing opens it in AD–AS Model with these settings, to change anything and copy or download your own.

Free to use in your tests, worksheets, slides or anything else, no credit needed. Public domain under CC0 1.0. How to reuse our figures

More AD–AS Model examples