
Negative supply shock on the AD–AS graph: SRAS shifts left (stagflation)
An example figure from the AD–AS Model generator.
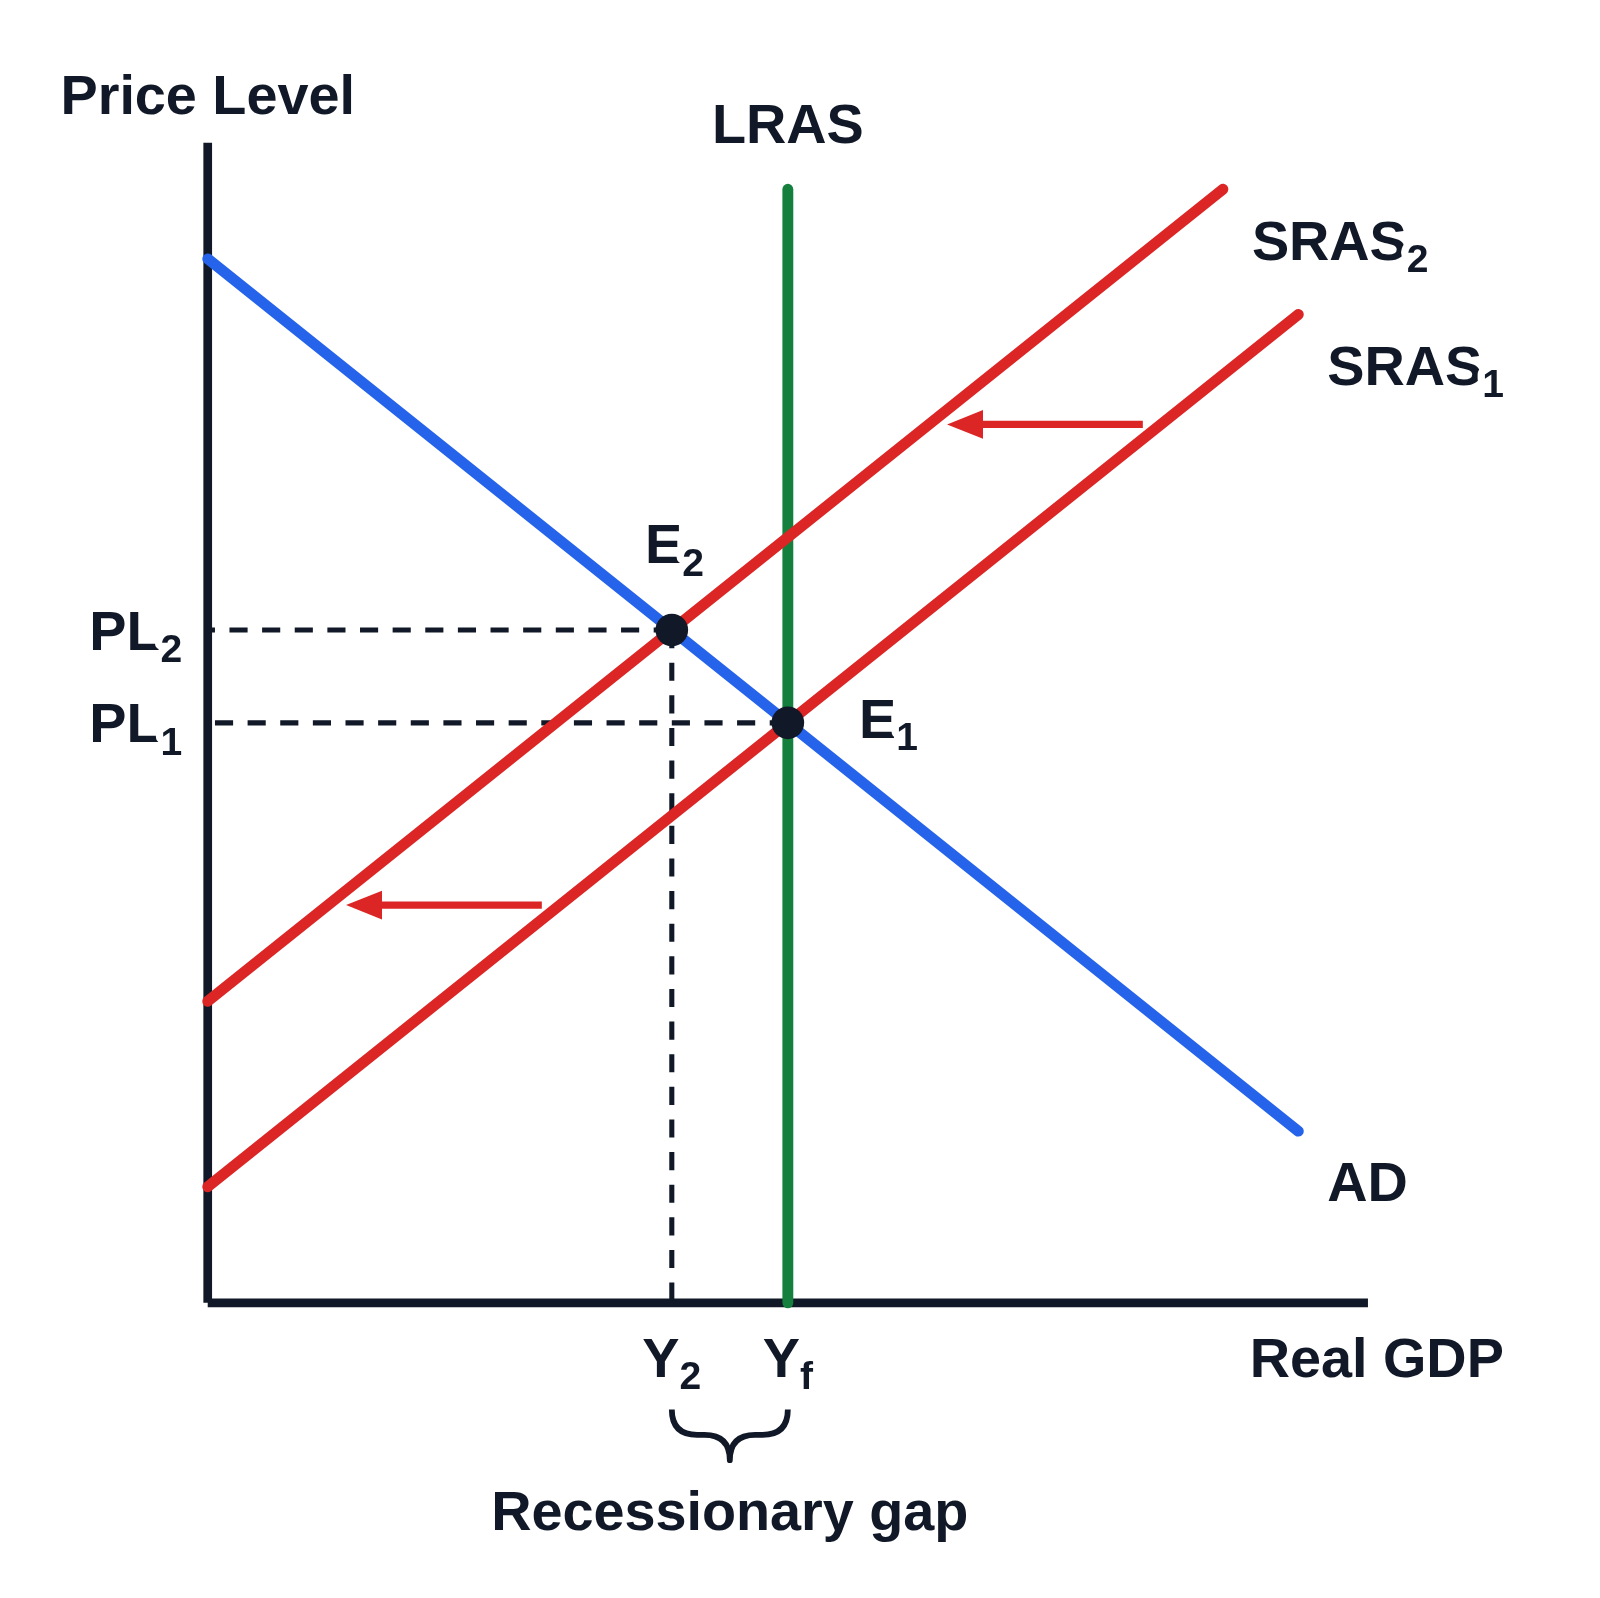
Editing opens it in AD–AS Model with these settings, to change anything and copy or download your own.
Free to use in your tests, worksheets, slides or anything else, no credit needed. Public domain under CC0 1.0. How to reuse our figures
More AD–AS Model examples
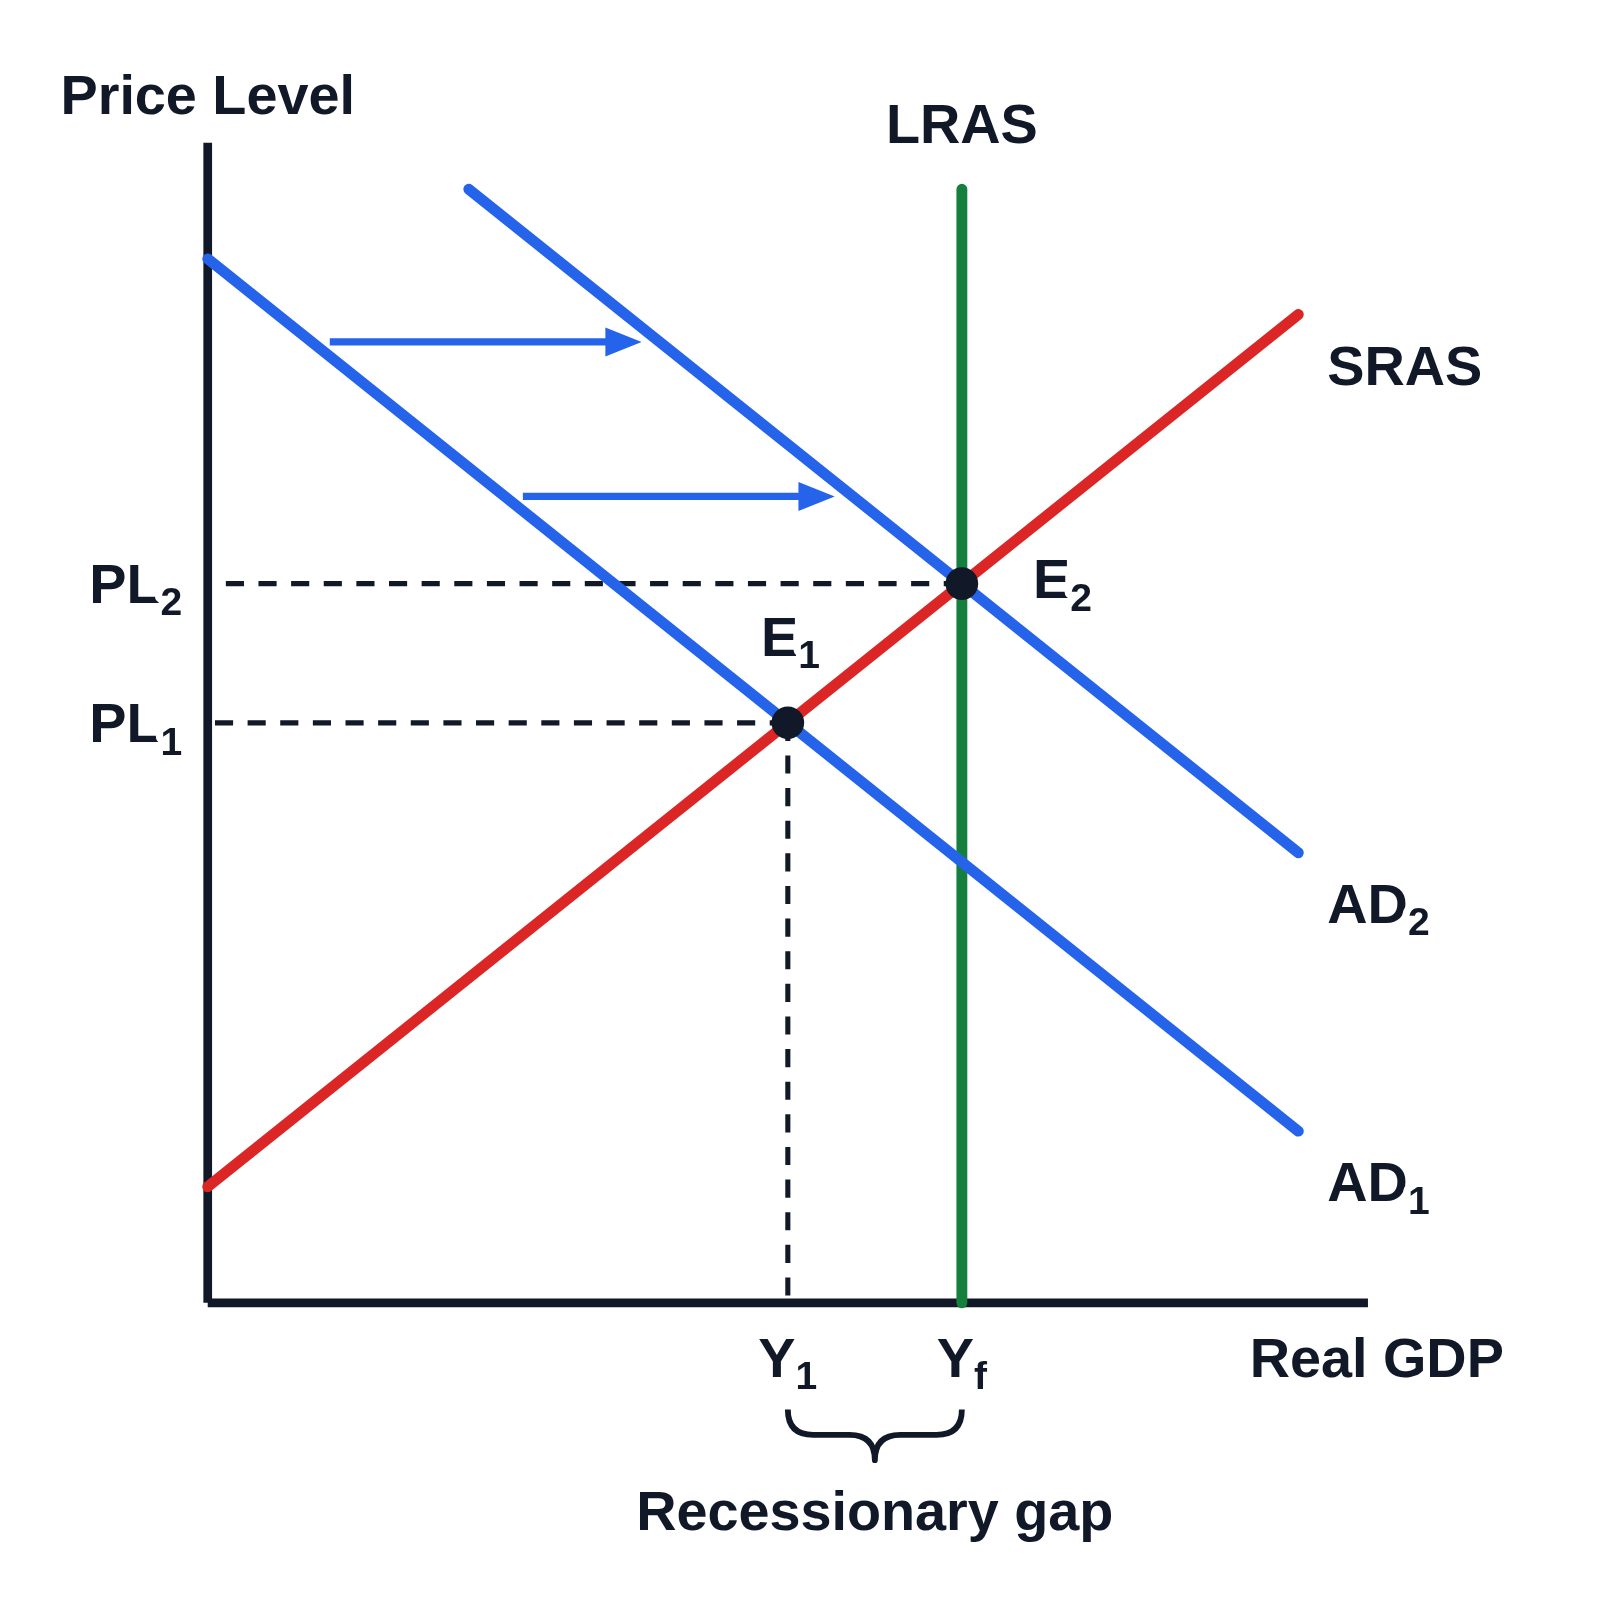 AD–AS graph of a recessionary gap closed by expansionary fiscal policy (AD shifts right)
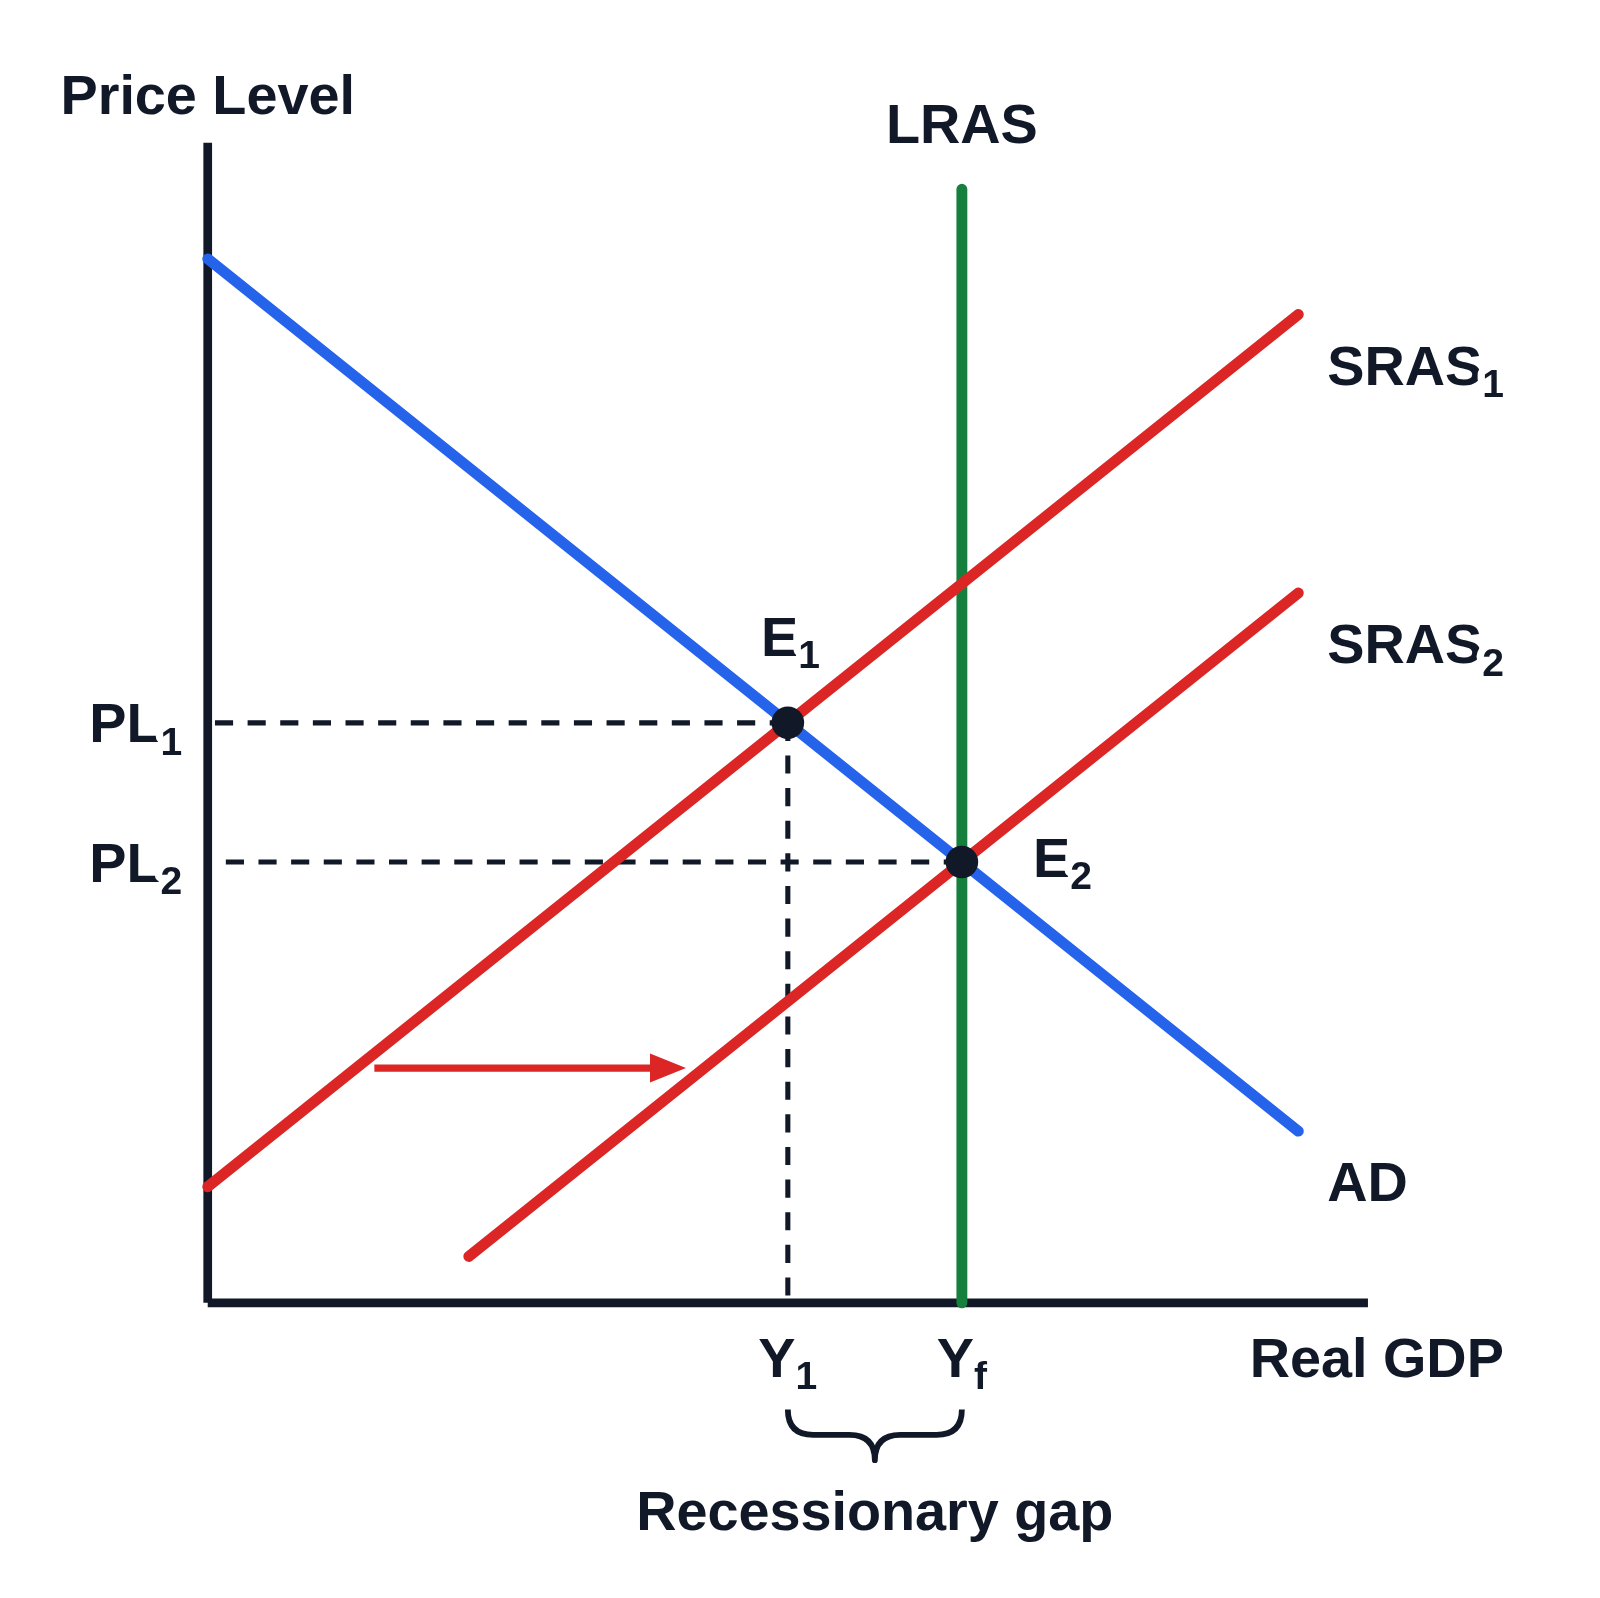 Long-run self-adjustment from a recessionary gap on the AD–AS graph (SRAS shifts right)
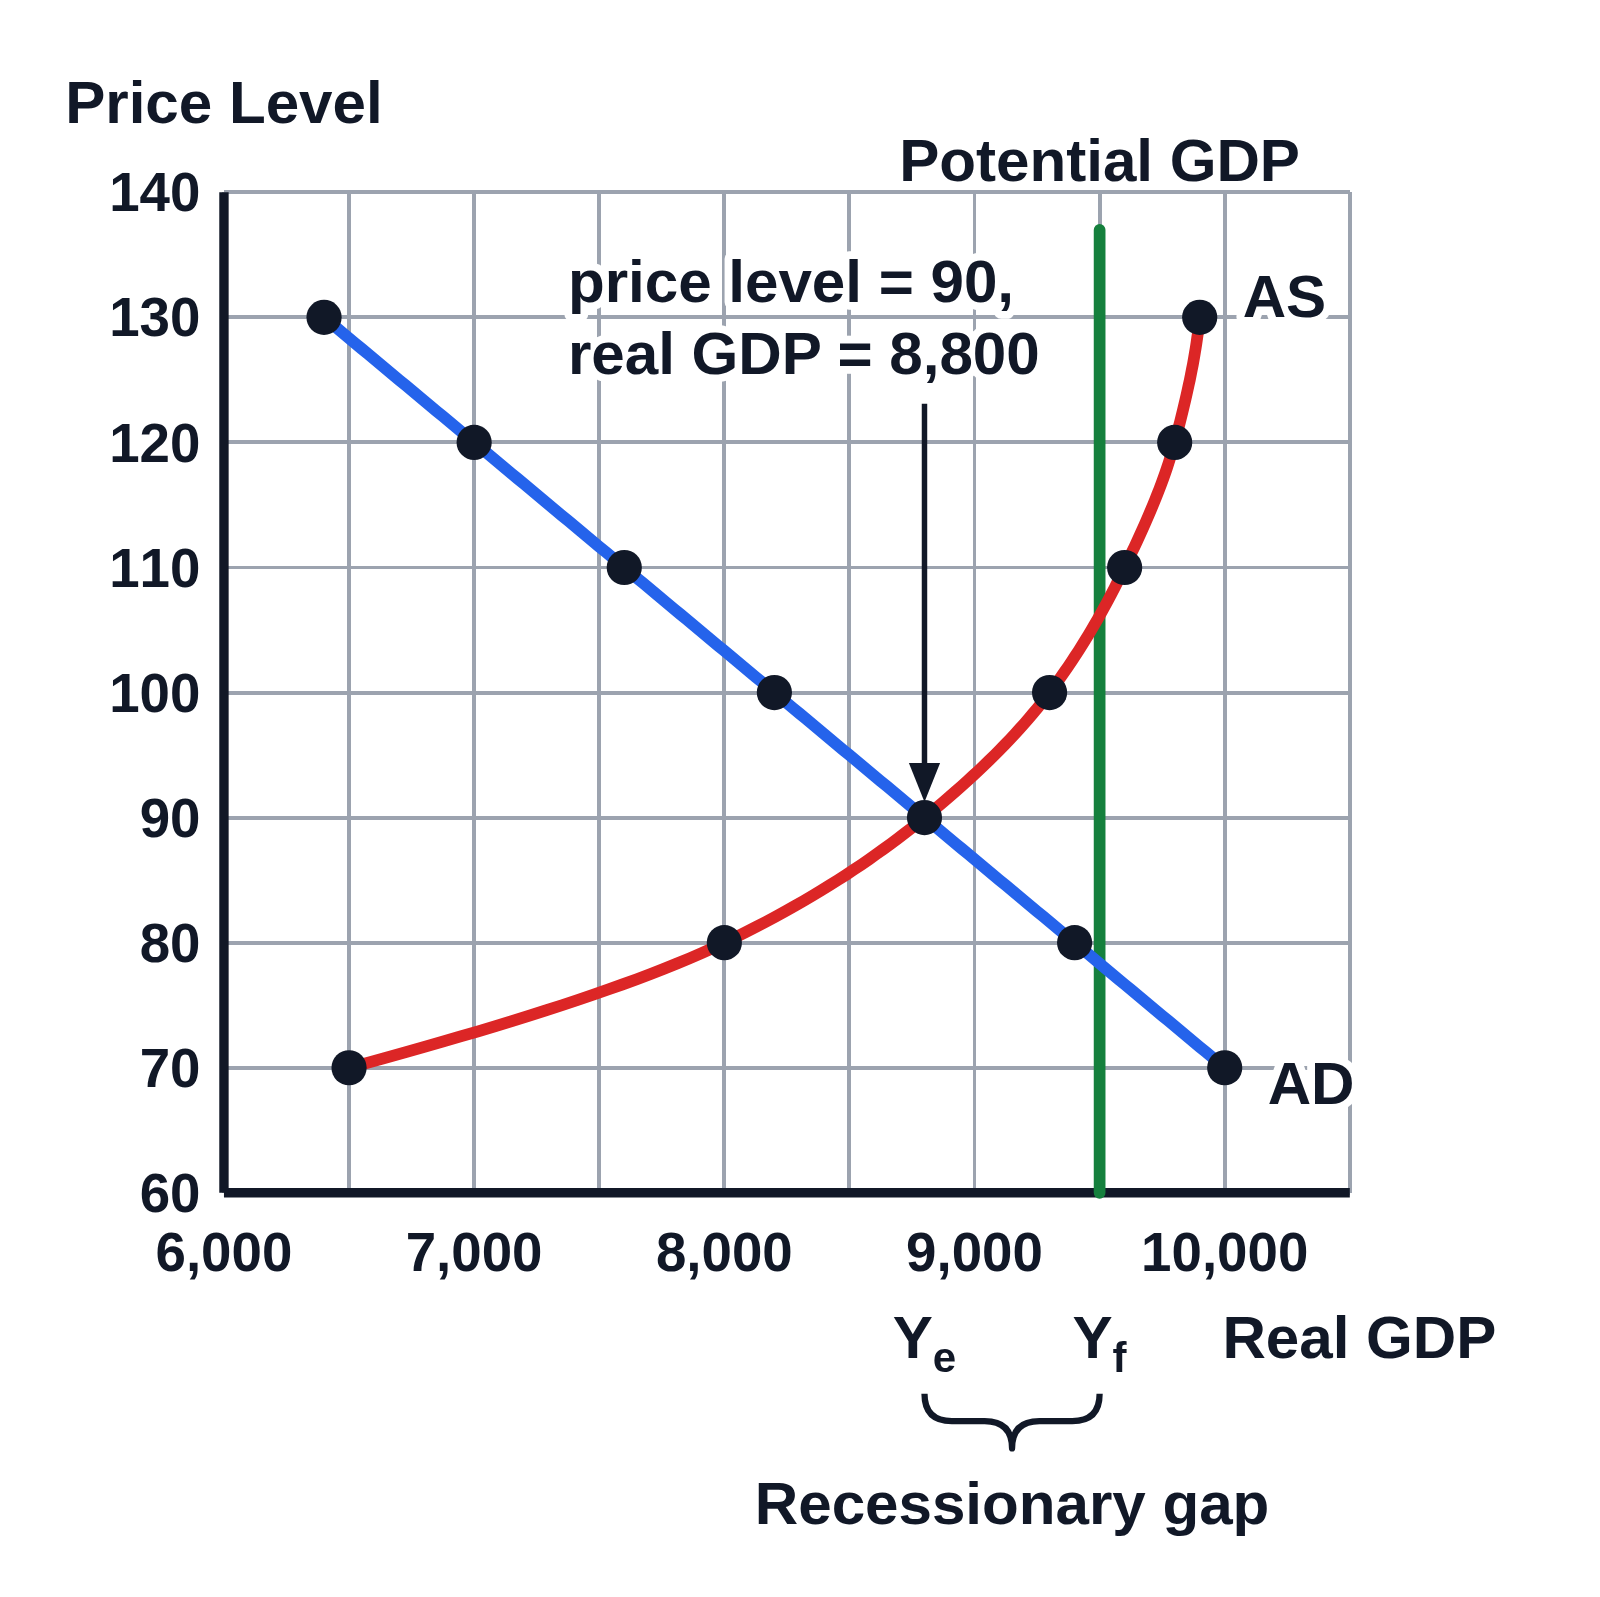 Numbered AD–AS graph from a schedule: equilibrium at price level 90 and real GDP 8,800
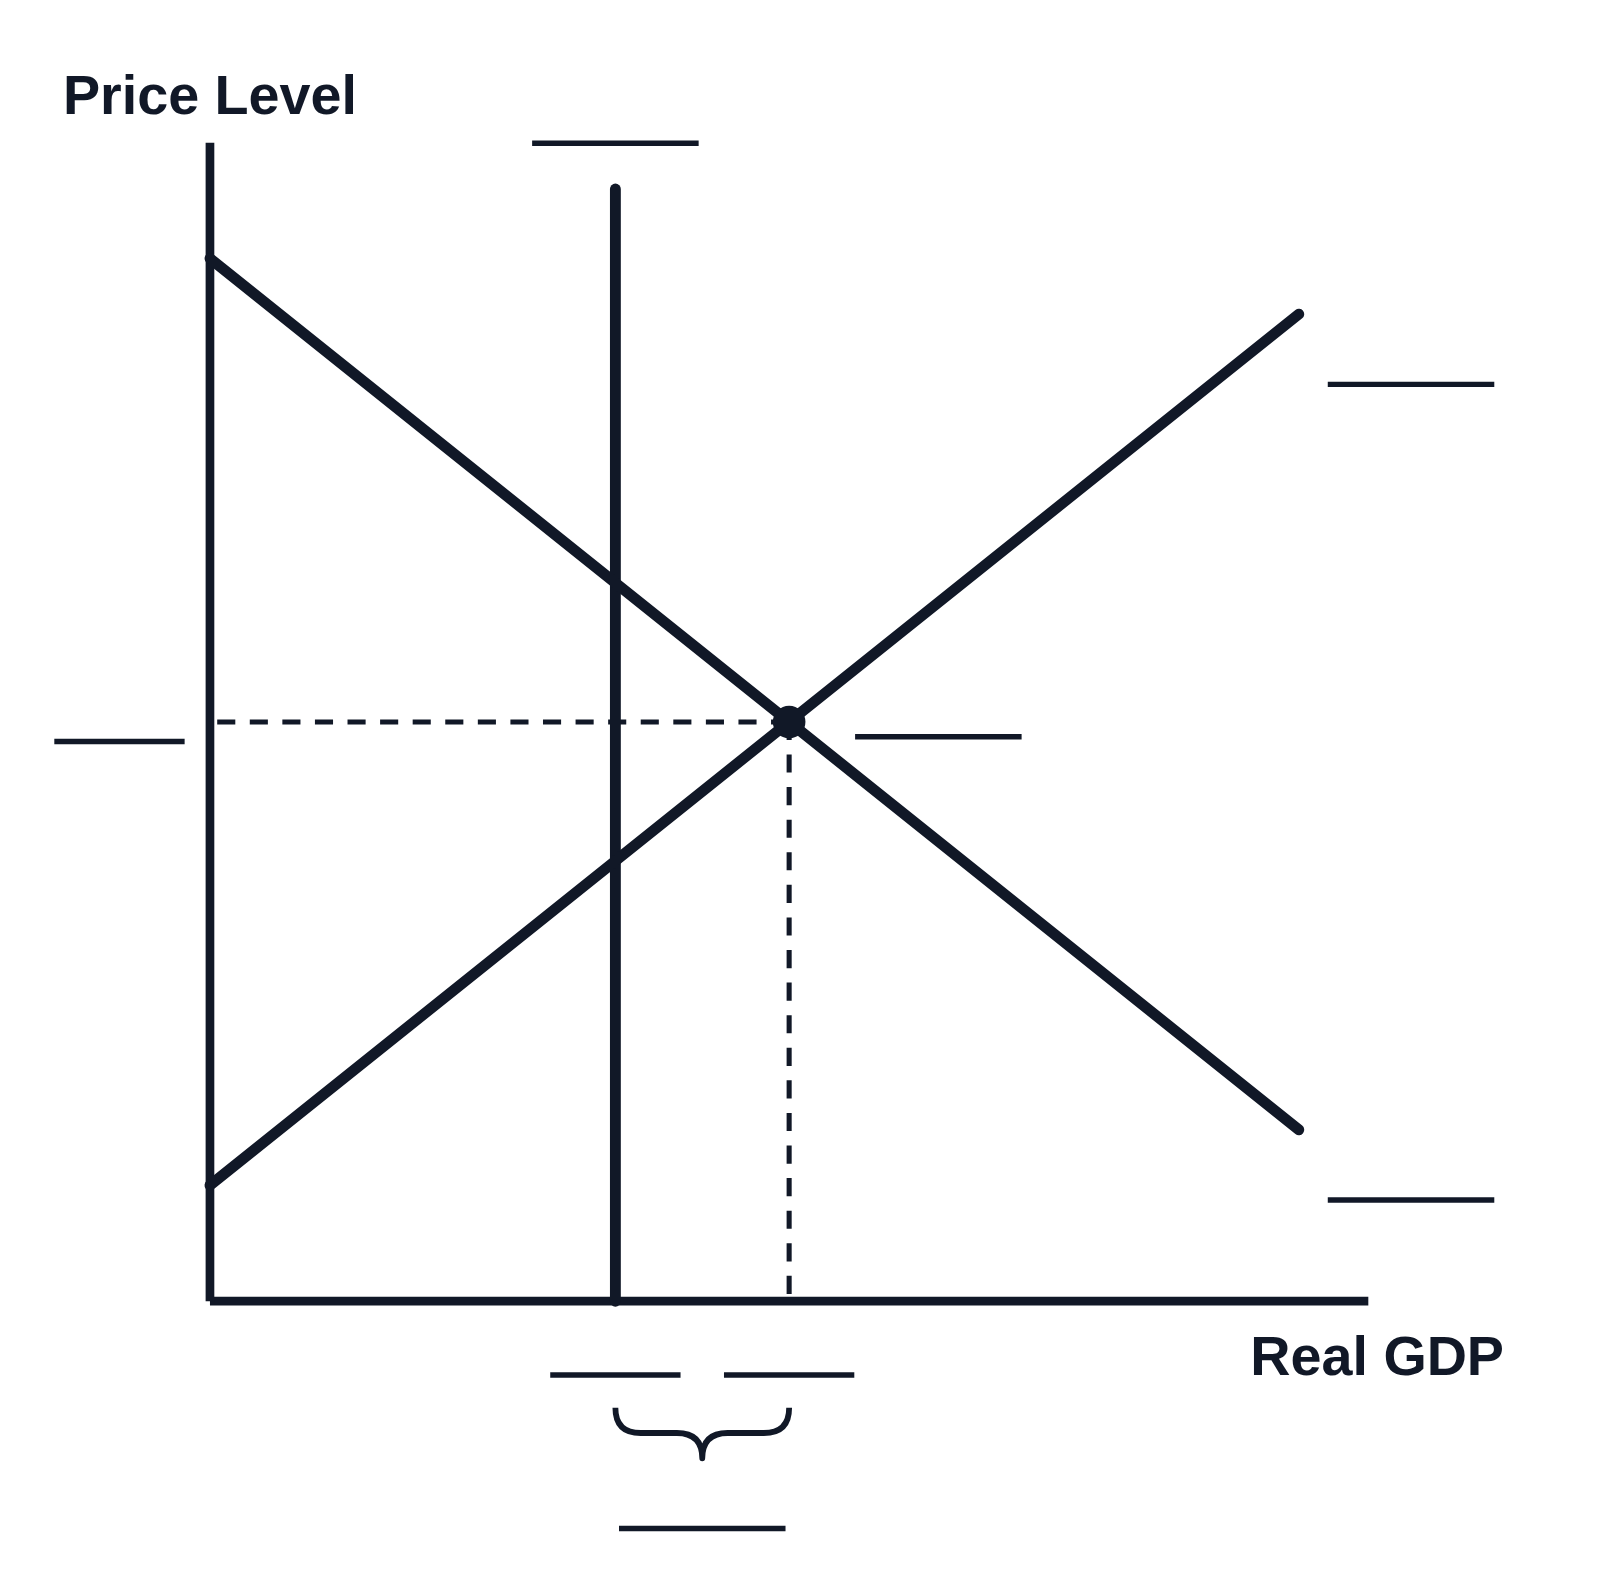 AD–AS graph worksheet: label an inflationary gap