Numbered AD–AS graph from a schedule: equilibrium at price level 90 and real GDP 8,800

An example figure from the AD–AS Model generator.
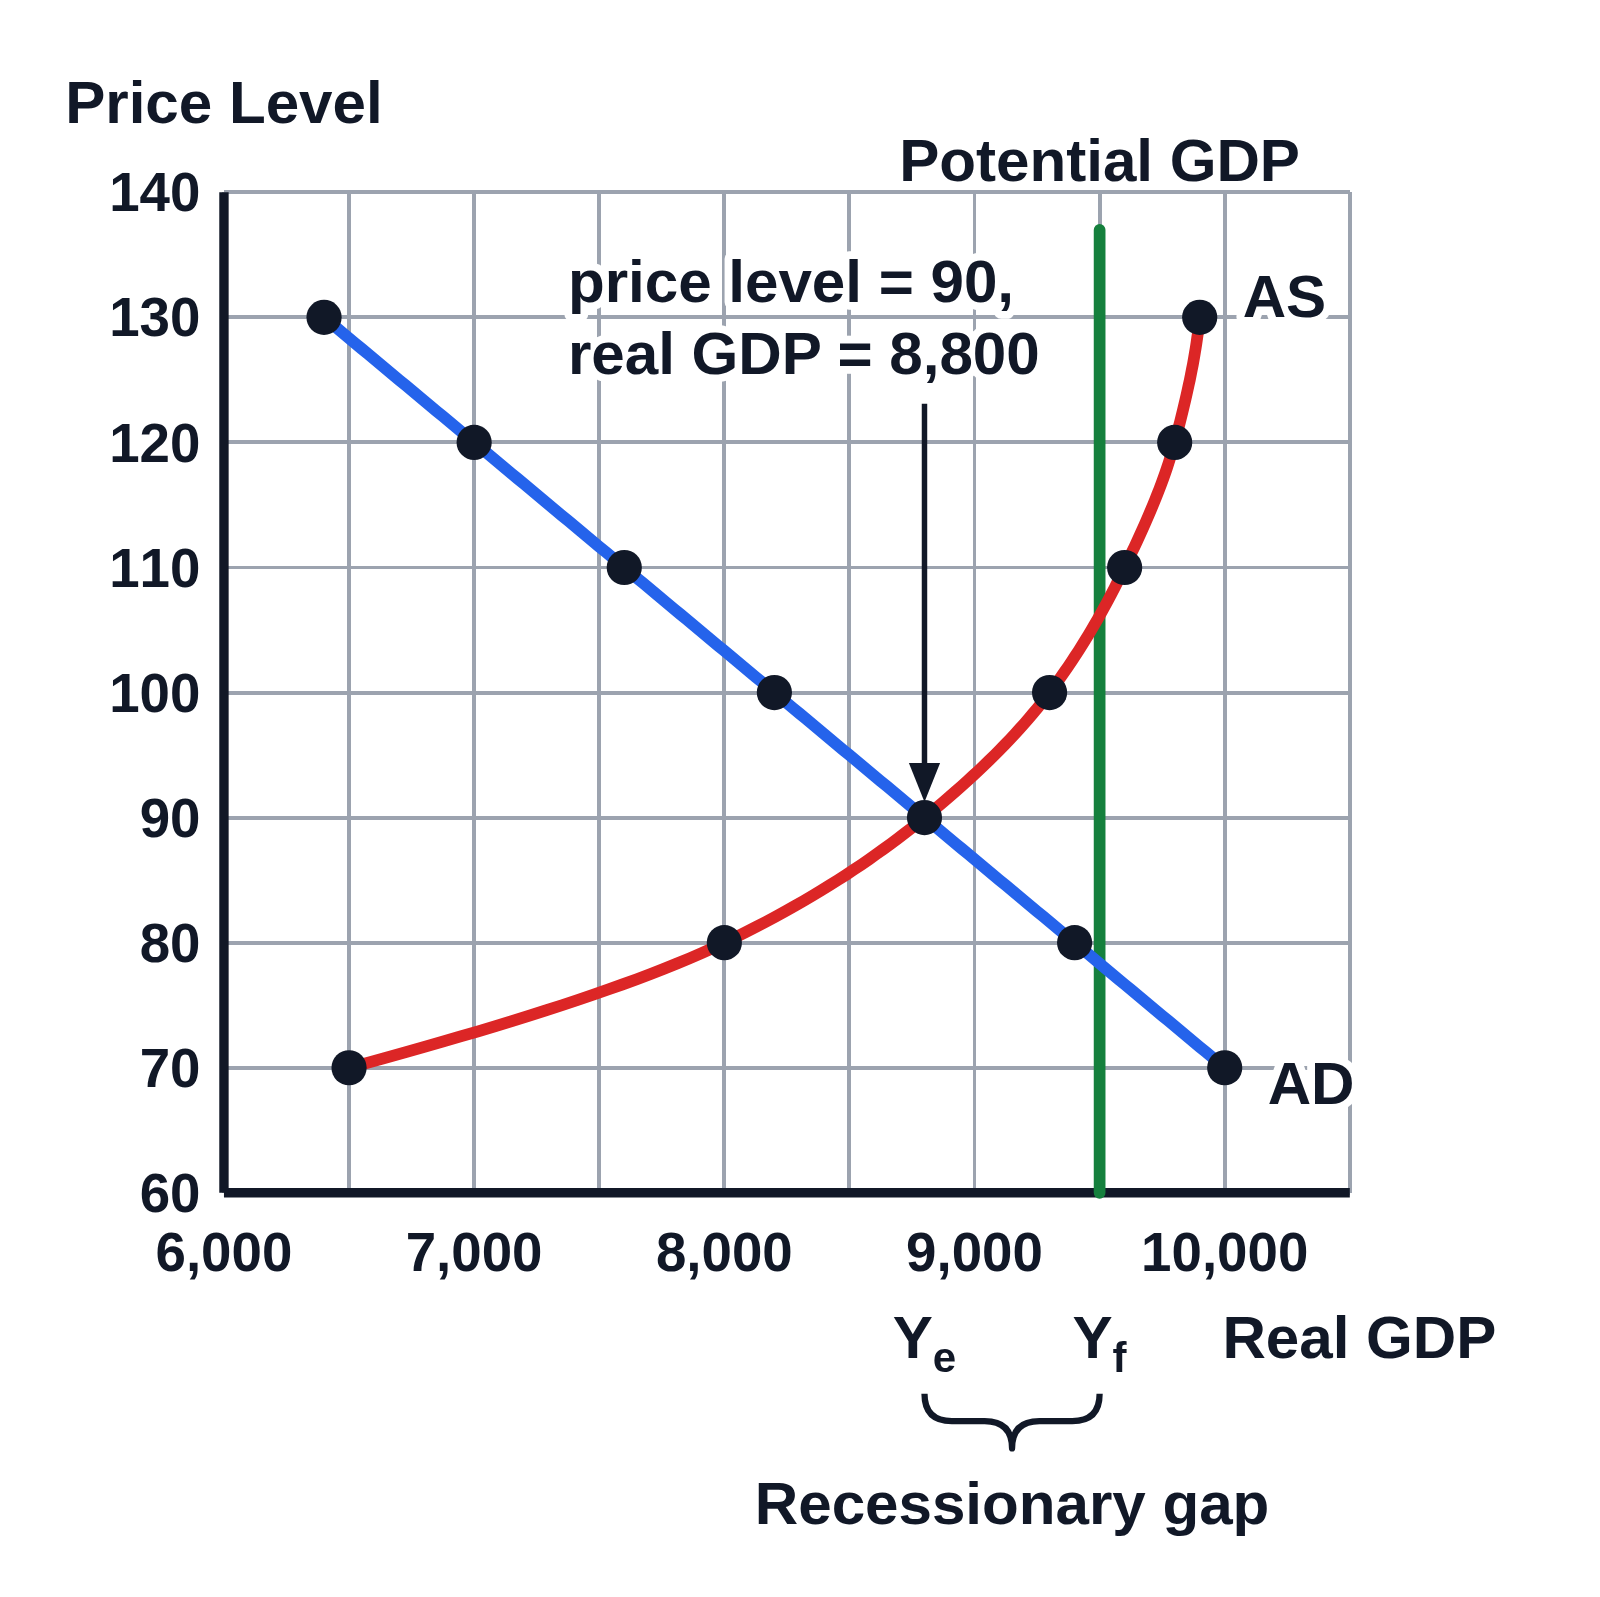
AD–AS graph on numbered axes with gridlines, price level from 60 to 140 by 10 and real GDP from 6,000 to 10,500, numbered every 1,000: a blue AD line falling through a dot at each row of the schedule, from 6,400 at a price level of 130 to 10,000 at 70; a red AS curve rising through its dots from 6,500 at 70, steepening to 9,900 at 130; and a vertical green line at 9,500 labeled Potential GDP. A callout with an arrow to where AD and AS cross reads price level = 90, real GDP = 8,800, and a brace under the axis from Yₑ at 8,800 to Yf at 9,500 is labeled Recessionary gap
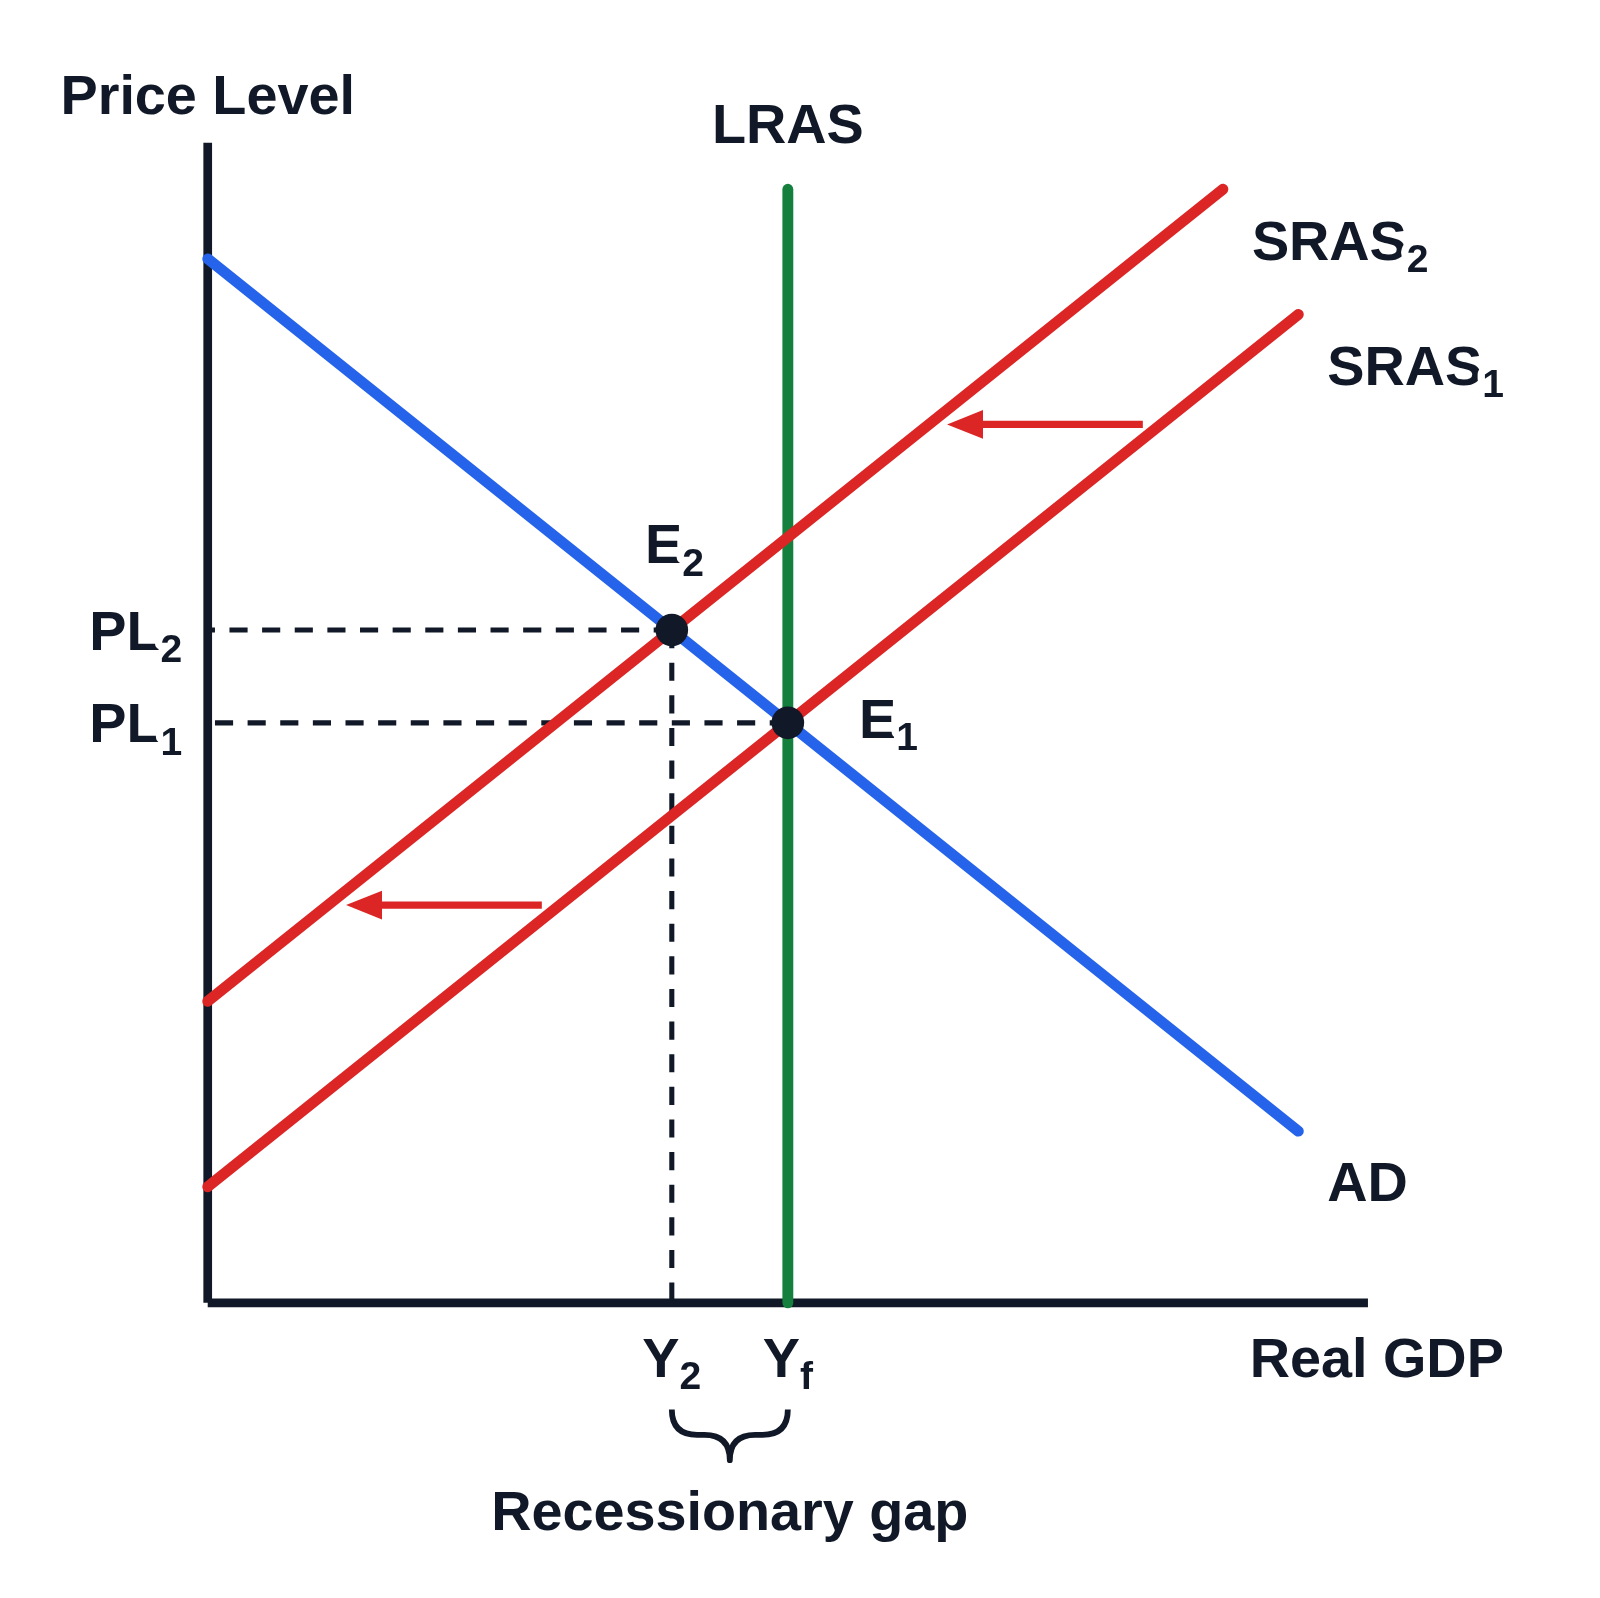
An AD–AS graph drawn from a schedule of seven price levels, from 70 to 130, with the real GDP demanded and supplied at each, a dot at each row. AD and AS cross at a price level of 90 and real GDP of 8,800, written in a callout. Potential GDP stands at 9,500, and the recessionary gap of 700 between them is braced under the axis.

Editing opens it in AD–AS Model with these settings, to change anything and copy or download your own.

Values

  • Equilibrium: price level 90, real GDP 8,800
  • Recessionary gap of 700: real GDP 8,800, potential 9,500

Free to use in your tests, worksheets, slides or anything else, no credit needed. Public domain under CC0 1.0. How to reuse our figures
More AD–AS Model examples