Loanable funds graph: crowding out from government deficit spending

An example figure from the Money Markets generator.
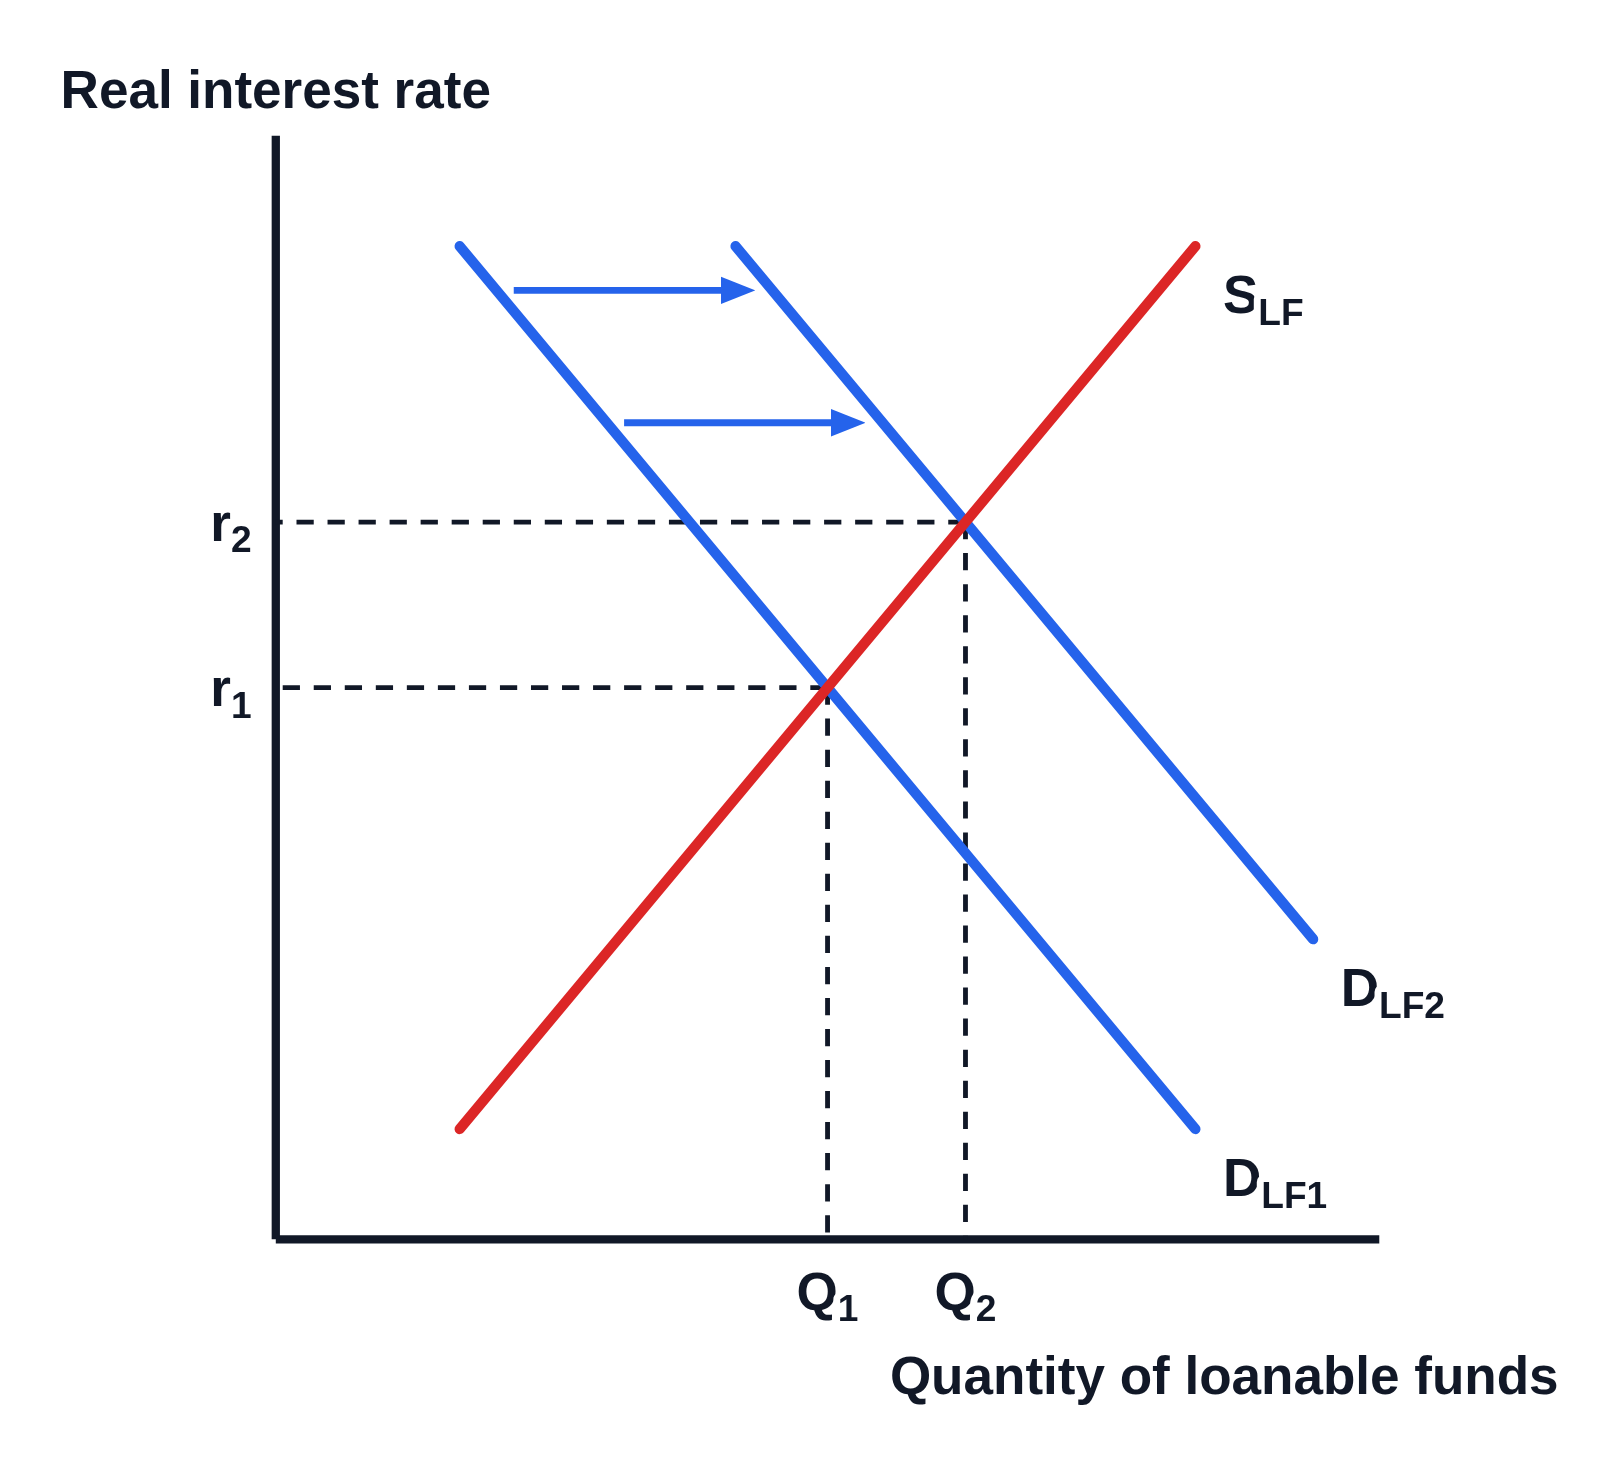
Loanable funds market graph with no numbers on the axes, Real interest rate up the side and Quantity of loanable funds along the bottom: an upward-sloping supply curve labeled SLF (red), a downward-sloping demand curve DLF₁ (blue) and a second demand curve DLF₂ to its right, two arrows pointing right from DLF₁ to DLF₂, and dashed lines from both equilibria to r₁ and the higher r₂ on the vertical axis and to Q₁ and Q₂ on the horizontal axis
The loanable funds market when the government borrows to cover a deficit. The demand for loanable funds increases from DLF₁ to DLF₂ along an unchanged supply curve SLF. The real interest rate rises from r₁ to r₂ and the quantity of loanable funds from Q₁ to Q₂, marked with dashed lines to both axes.

Editing opens it in Money Markets with these settings, to change anything and copy or download your own.

Free to use in your tests, worksheets, slides or anything else, no credit needed. Public domain under CC0 1.0. How to reuse our figures
More Money Markets examples