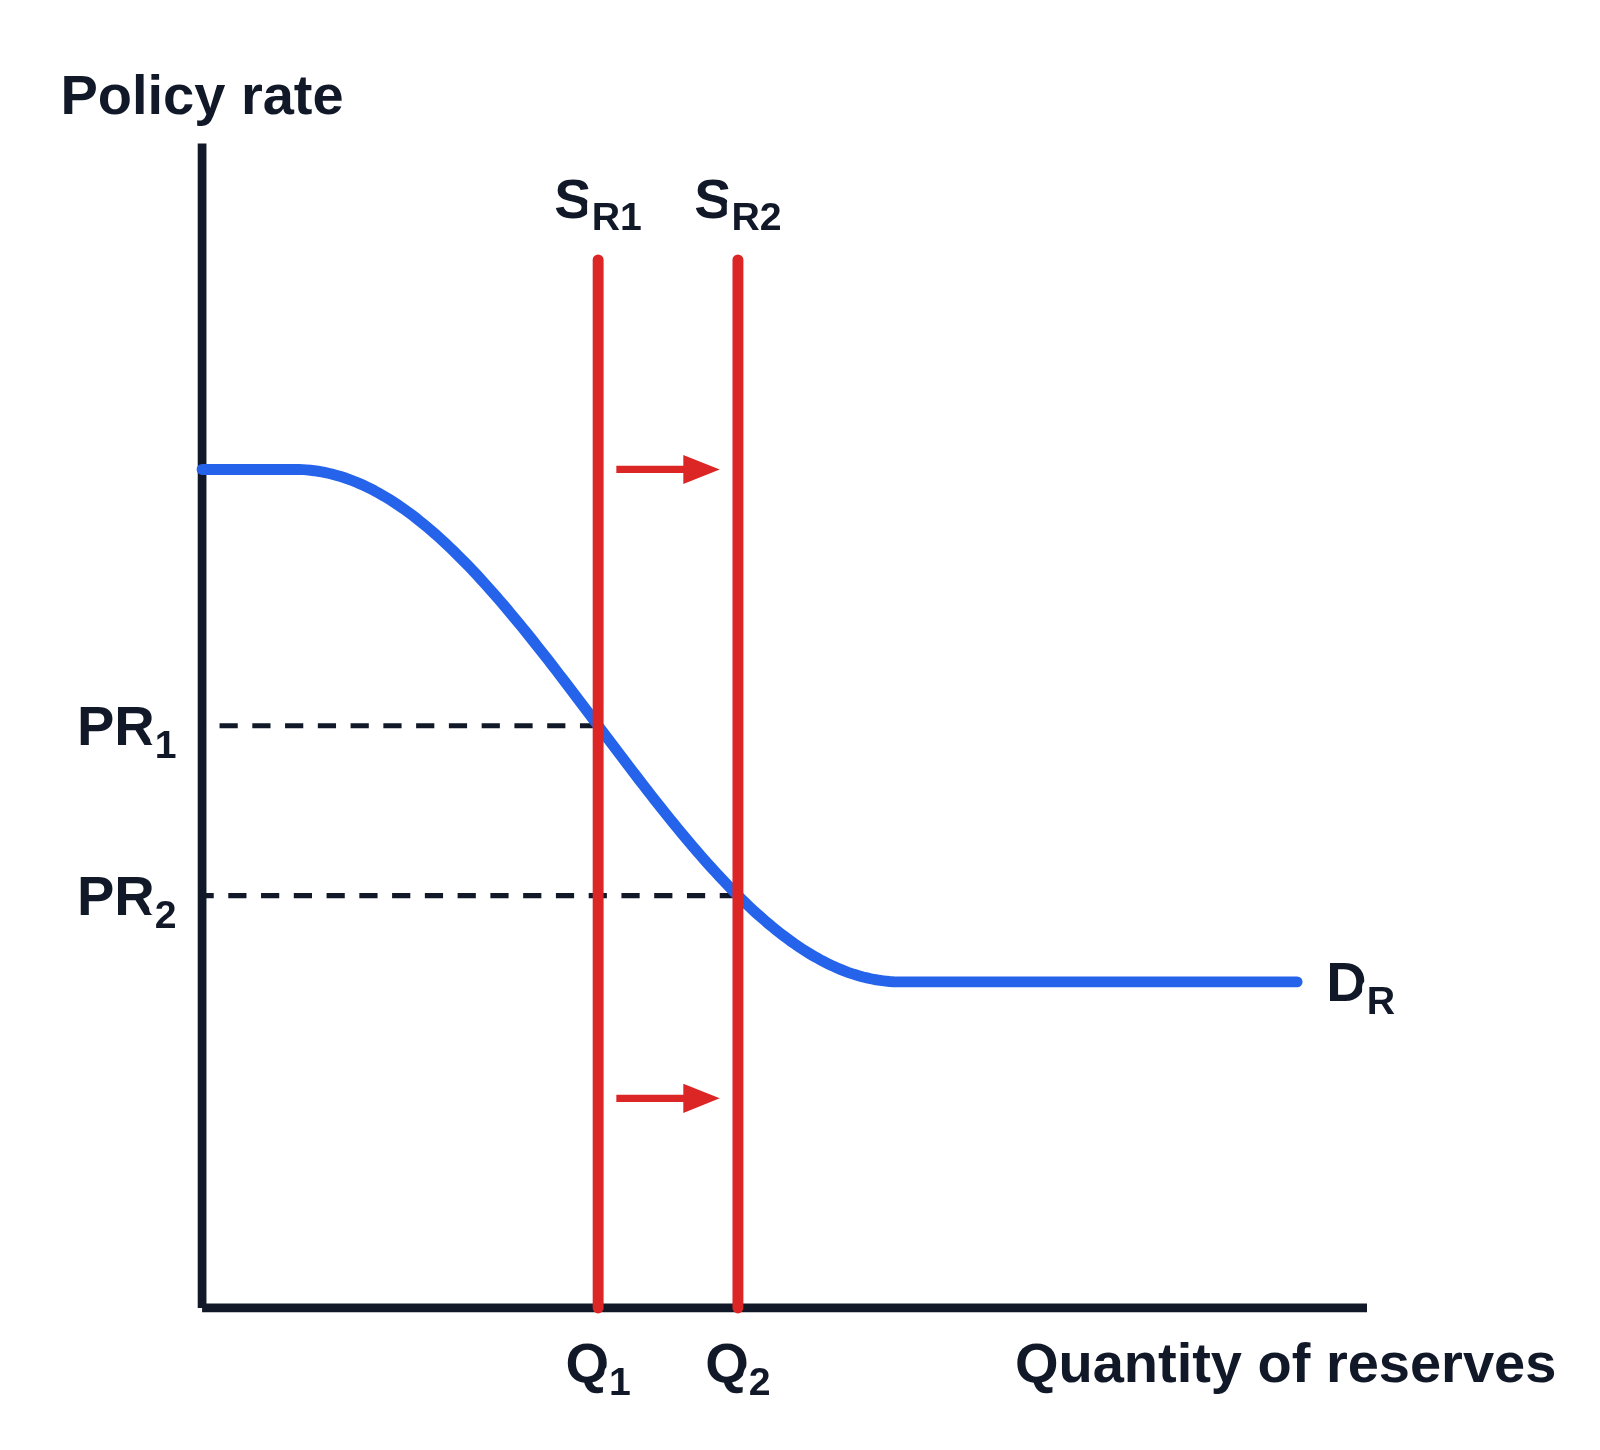
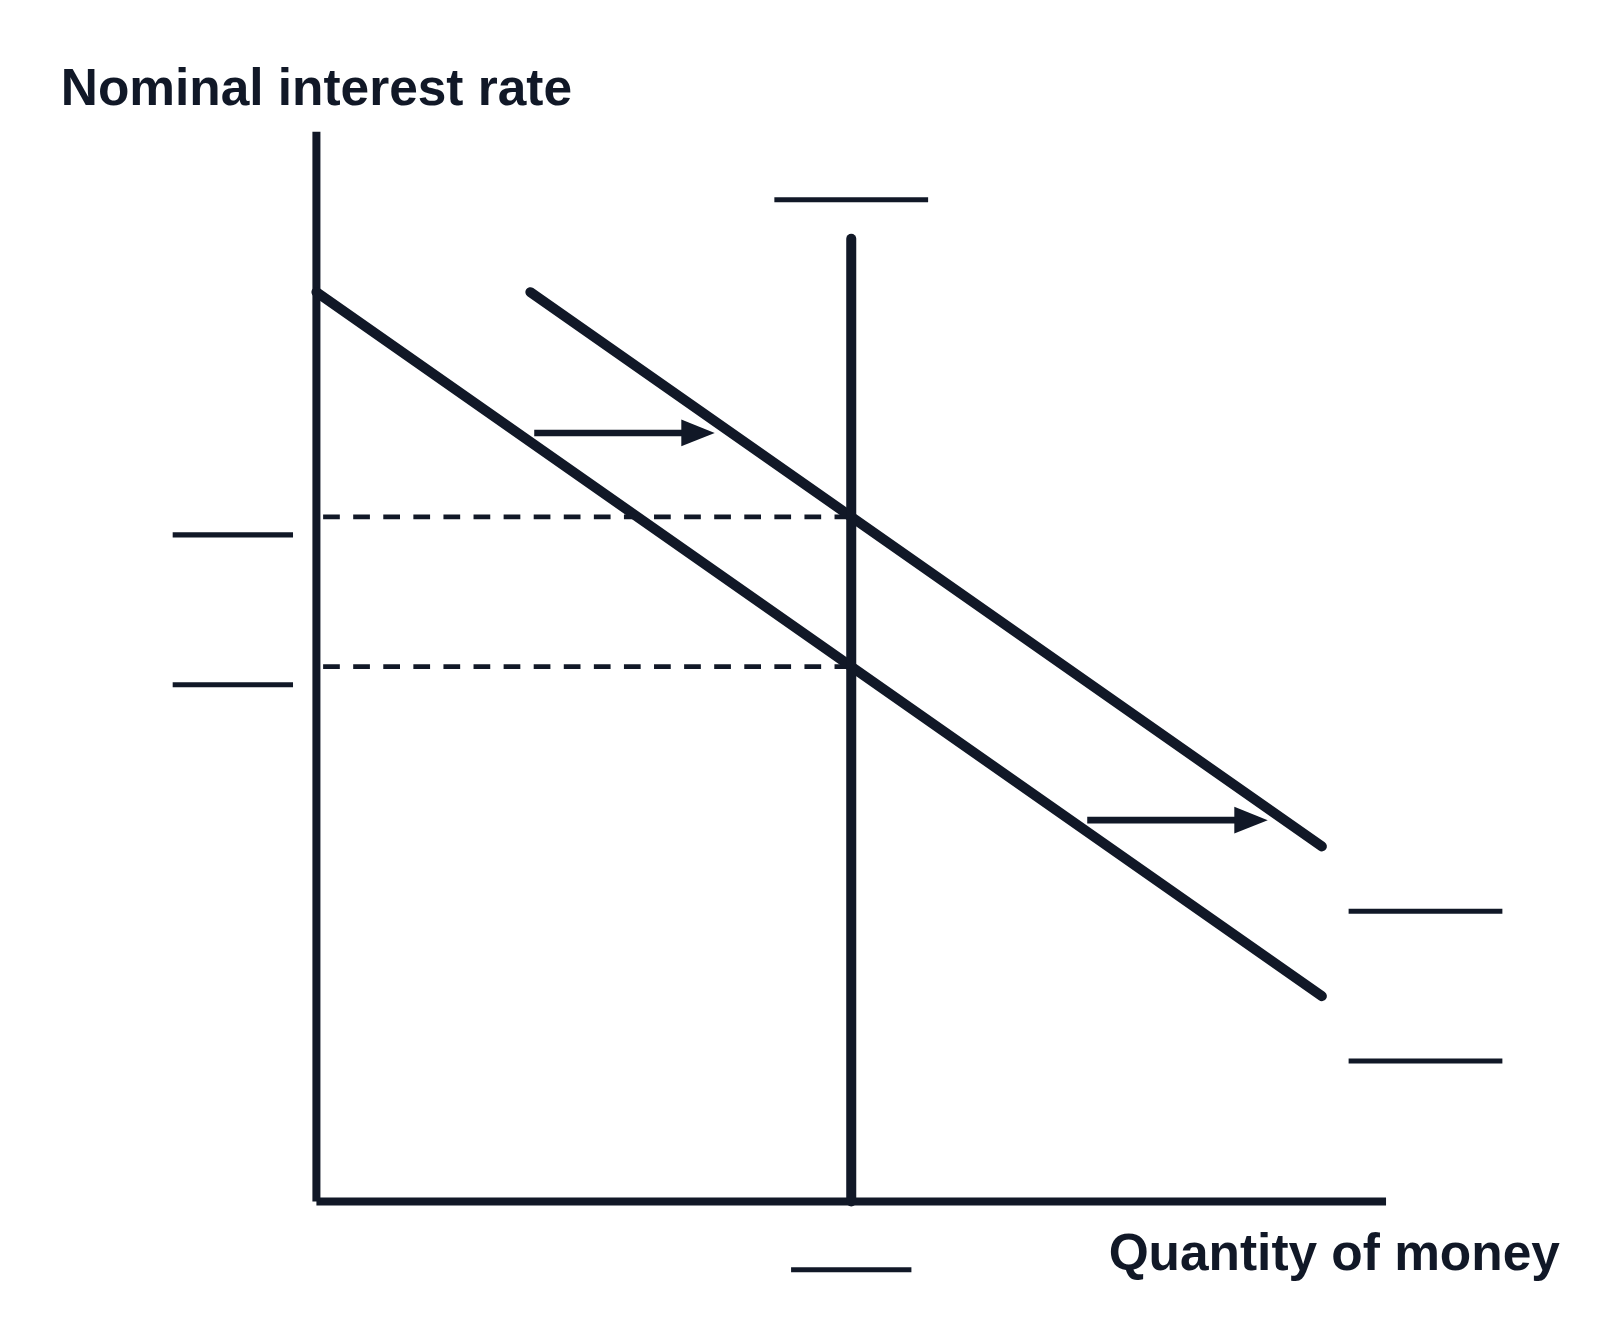
Money market graph: an increase in the money supply (open-market purchase)

An example figure from the Money Markets generator.
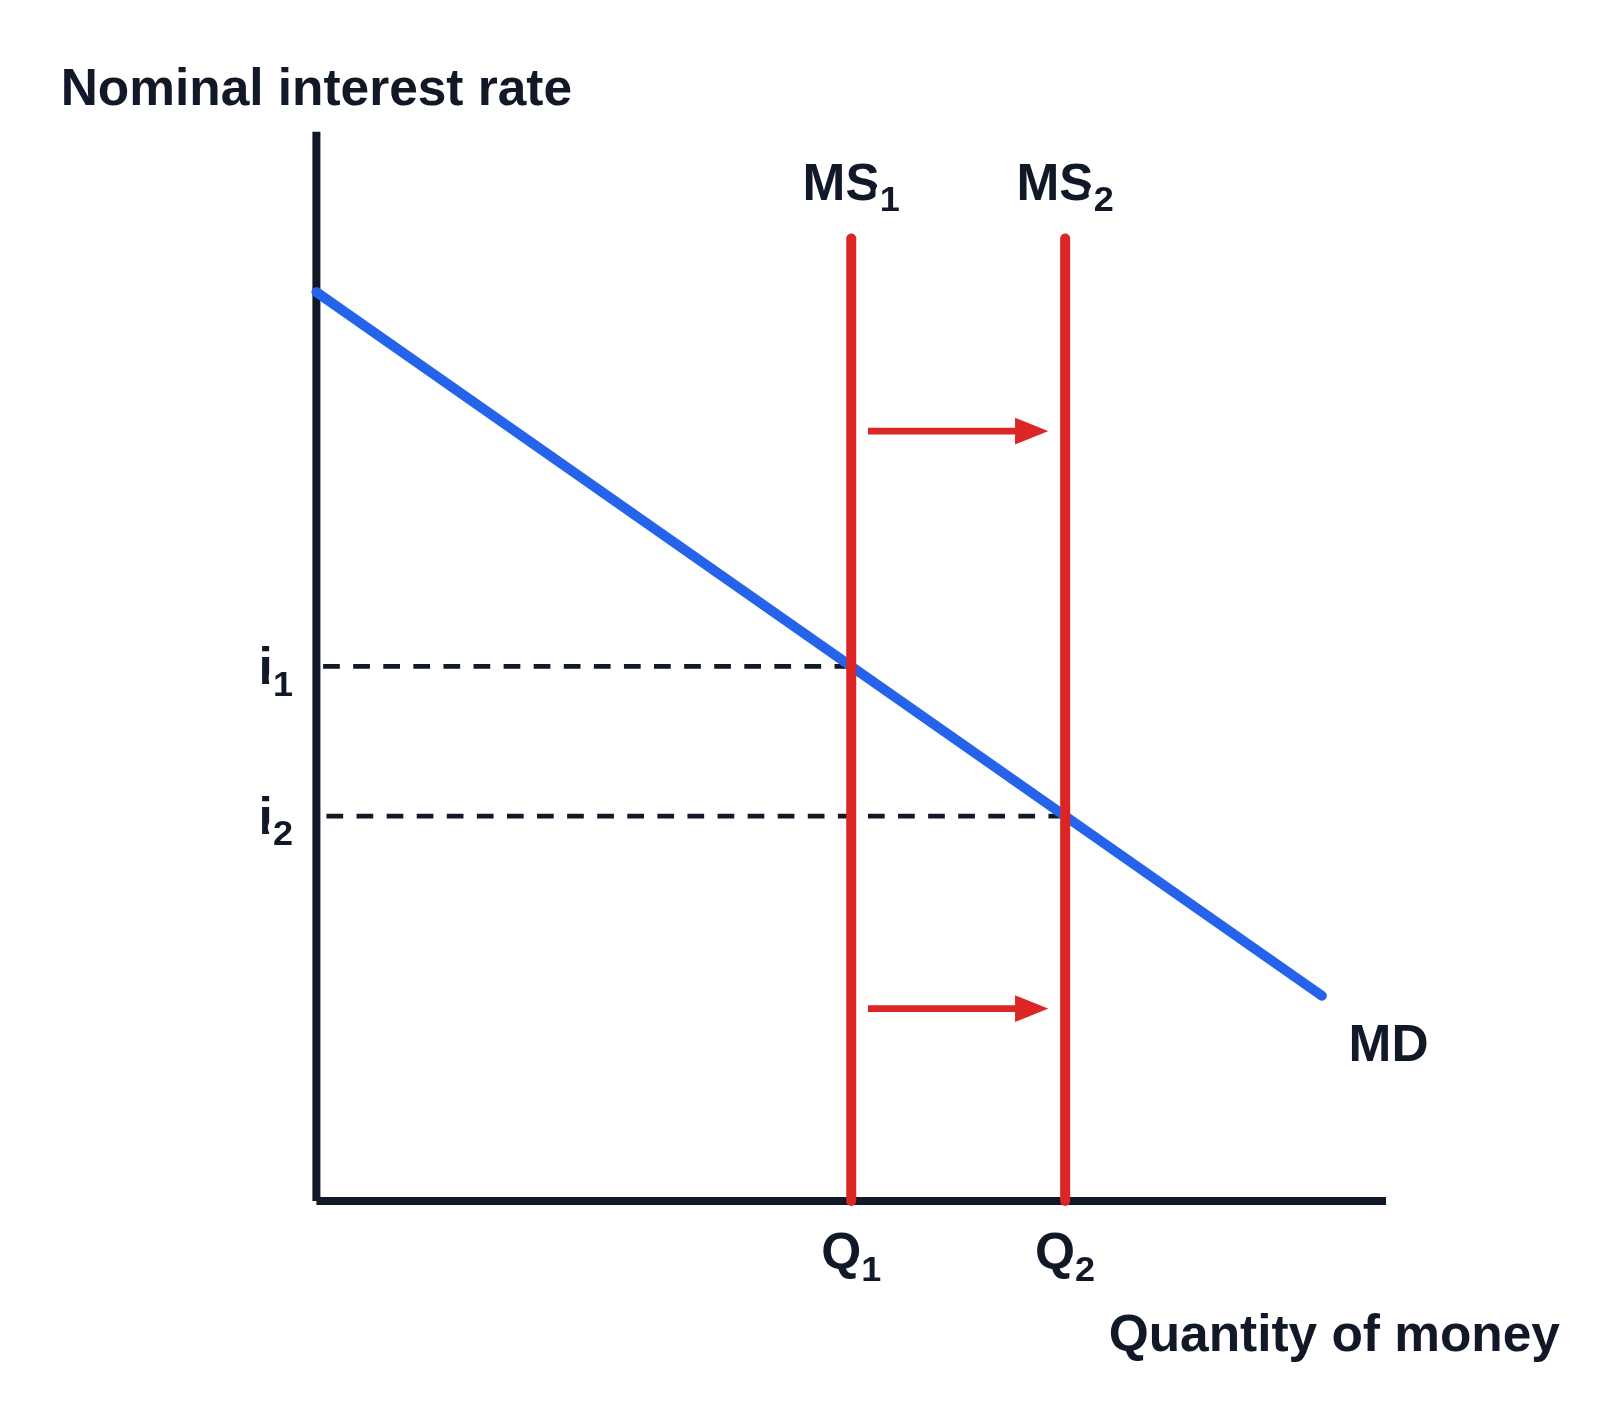
Money market graph with no numbers on the axes, Nominal interest rate up the side and Quantity of money along the bottom: a downward-sloping money demand curve labeled MD (blue), a vertical money supply curve MS₁ (red) and a second vertical curve MS₂ to its right, with two arrows pointing right from MS₁ to MS₂, dashed lines across from where each crosses MD to i₁ and the lower i₂ on the vertical axis, and Q₁ and Q₂ under the two supply curves
The money market after the money supply increases, as when the Fed buys bonds. The vertical money supply curve shifts right from MS₁ to MS₂, shown by two arrows, along the downward-sloping money demand curve MD. The nominal interest rate falls from i₁ to i₂, and the quantity of money rises from Q₁ to Q₂.

Editing opens it in Money Markets with these settings, to change anything and copy or download your own.

Free to use in your tests, worksheets, slides or anything else, no credit needed. Public domain under CC0 1.0. How to reuse our figures
More Money Markets examples