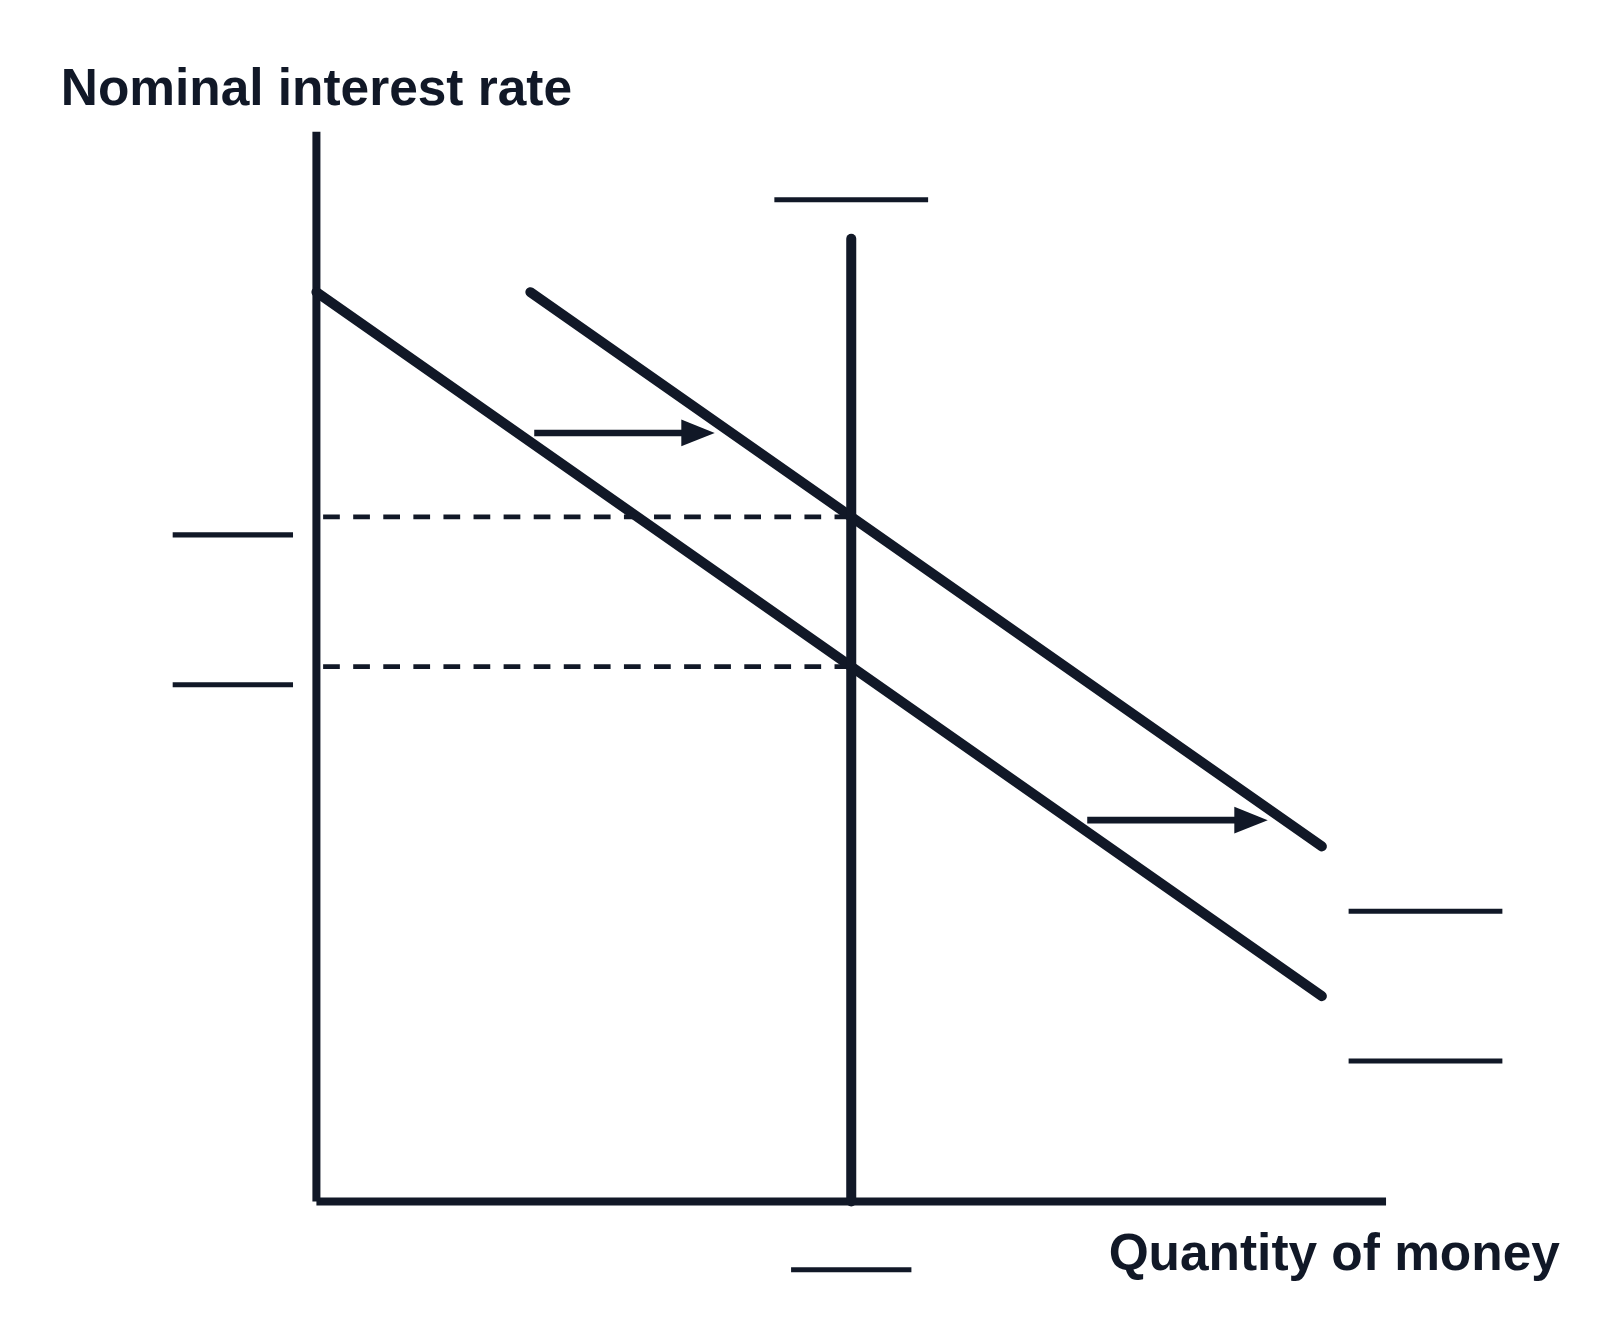
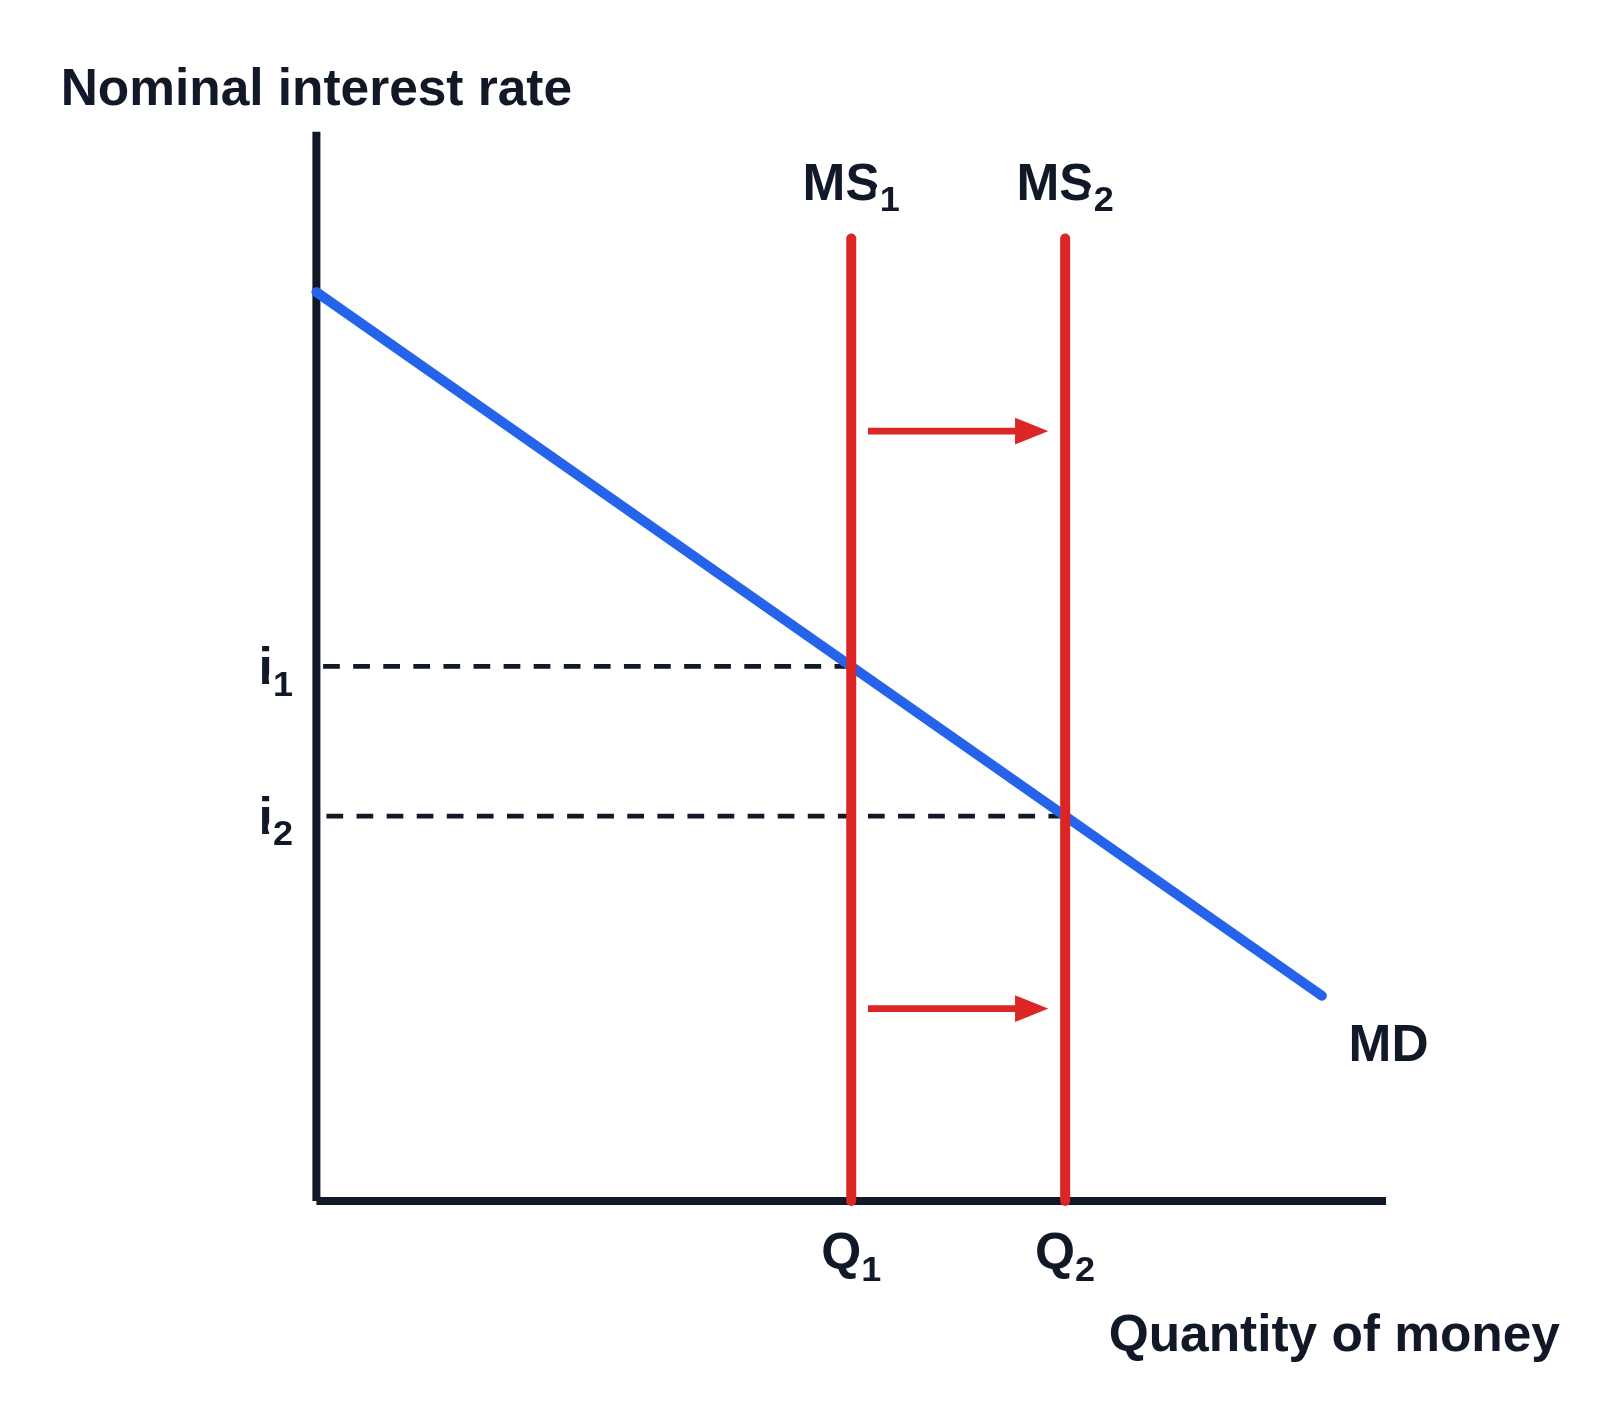
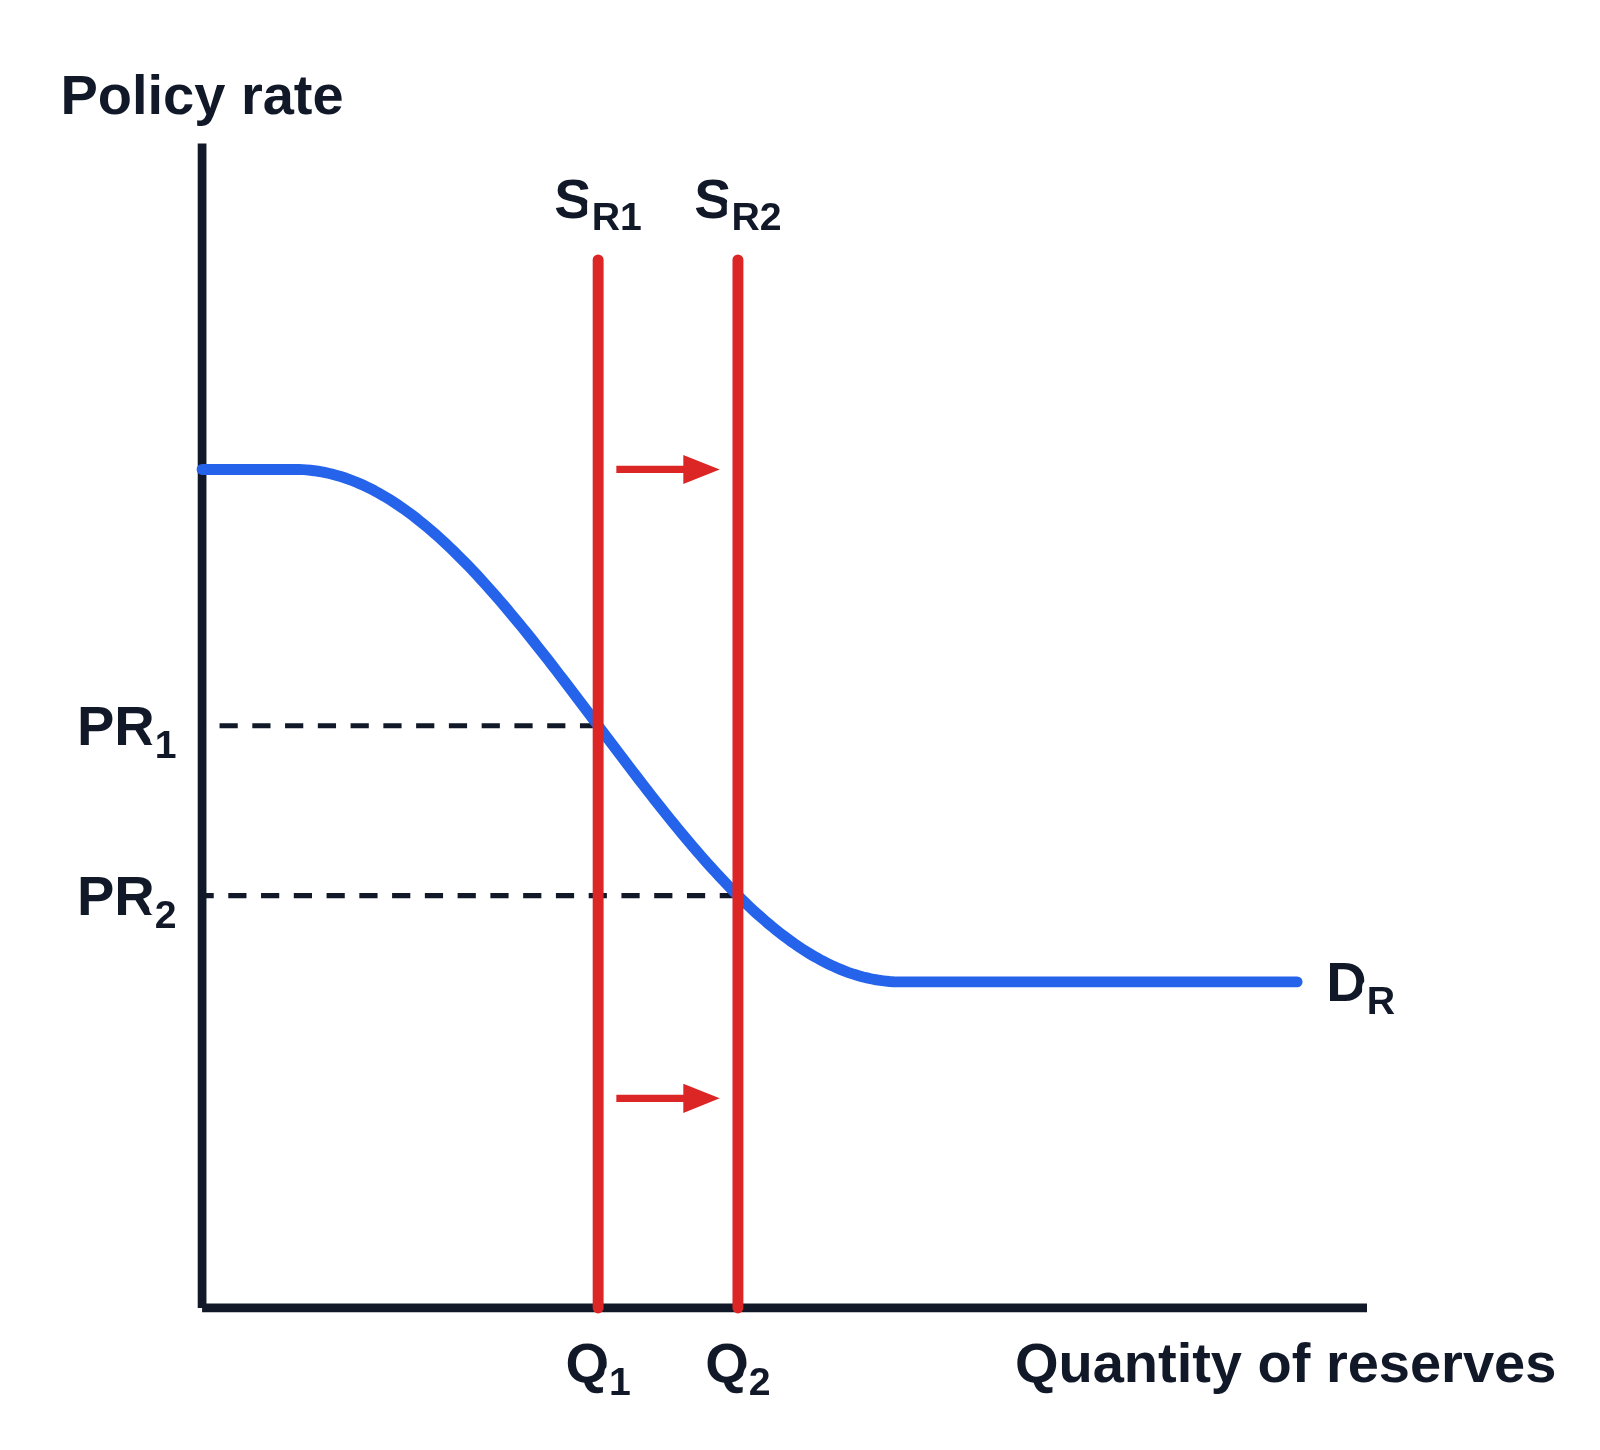
A worksheet money market graph in black and white, with no numbers on the axes. Money demand shifts right, shown by two arrows, along a vertical money supply curve, and dashed lines run across to the old and new interest rates. Each curve, both interest rates and the quantity of money have a blank line for students to label.