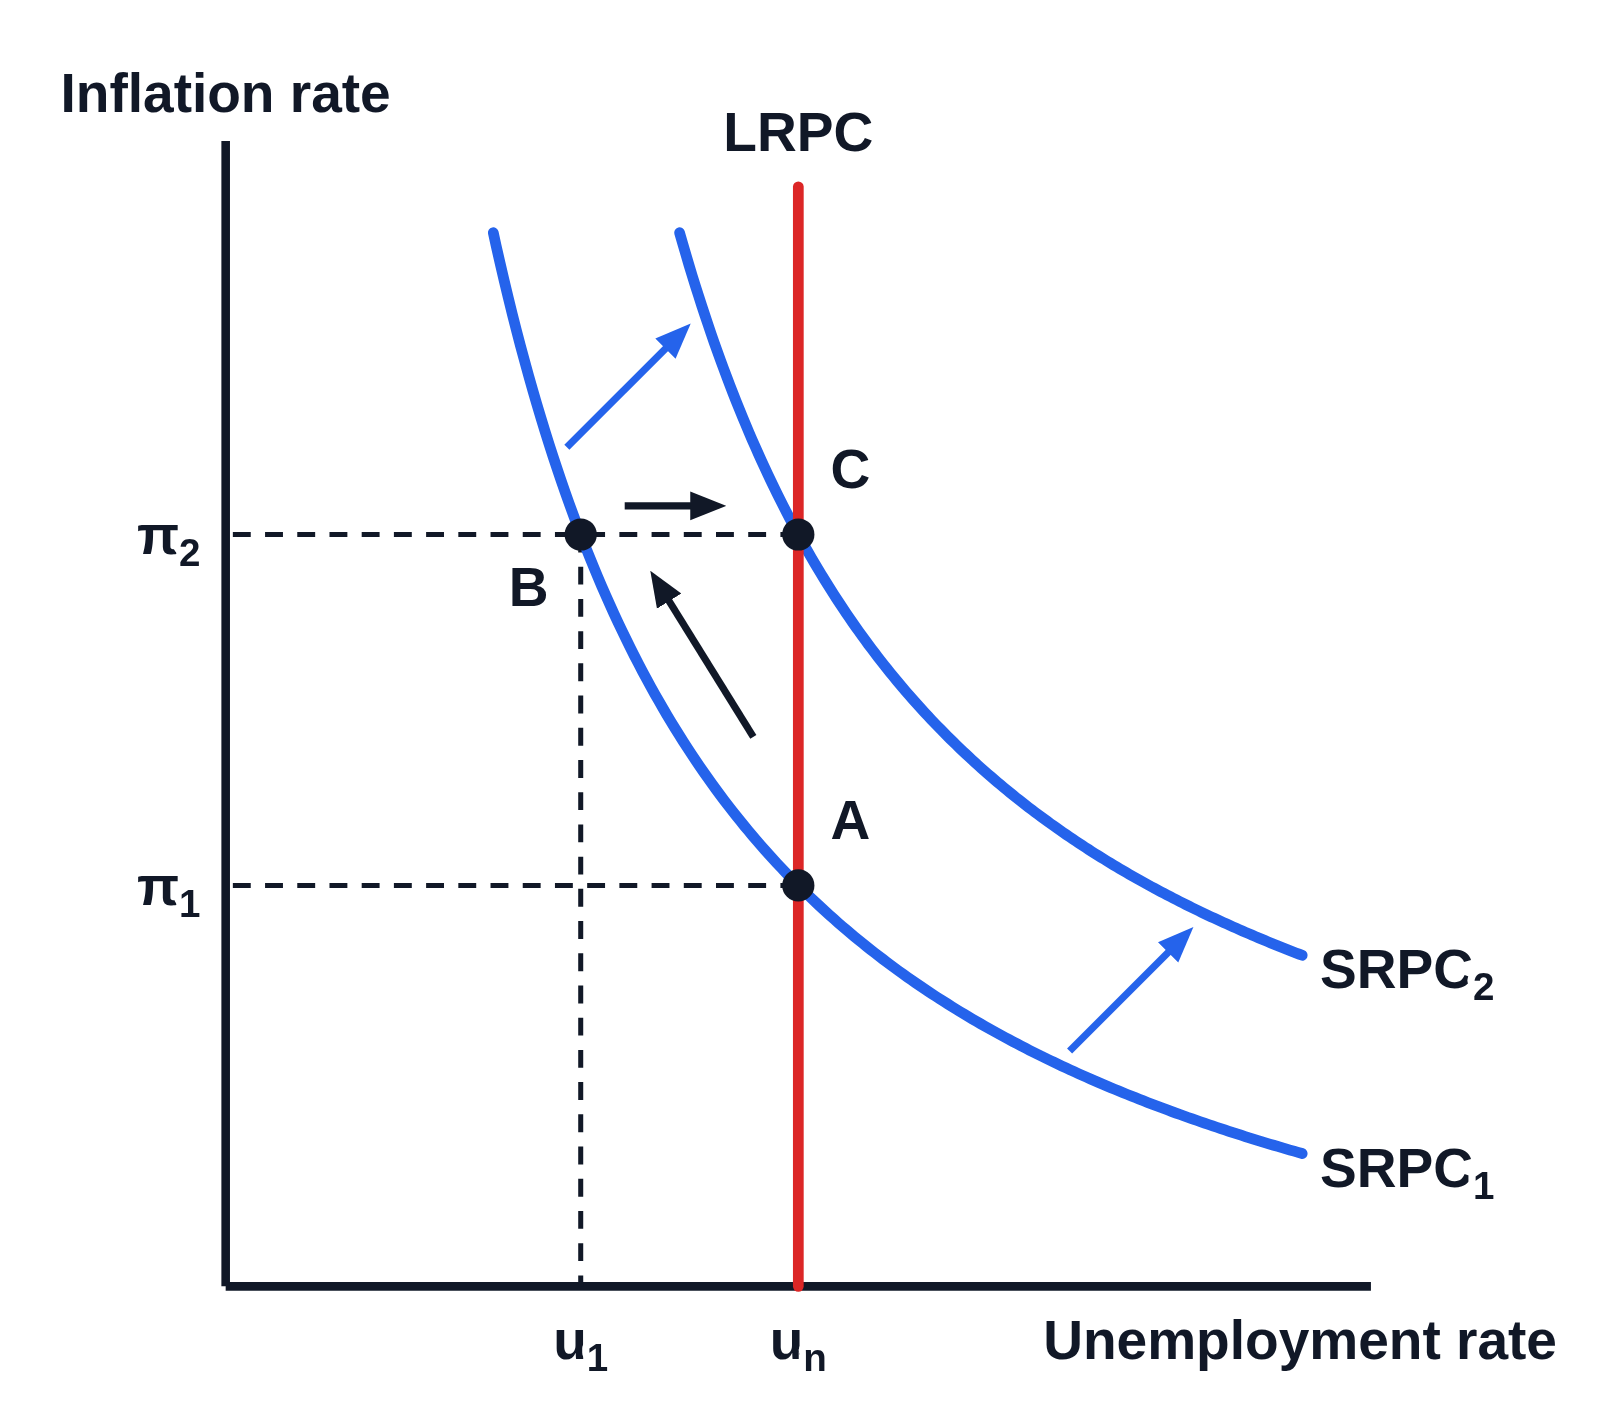
Phillips curve: expansionary policy in the short run and the long run (A to B to C)

An example figure from the Phillips Curve generator.

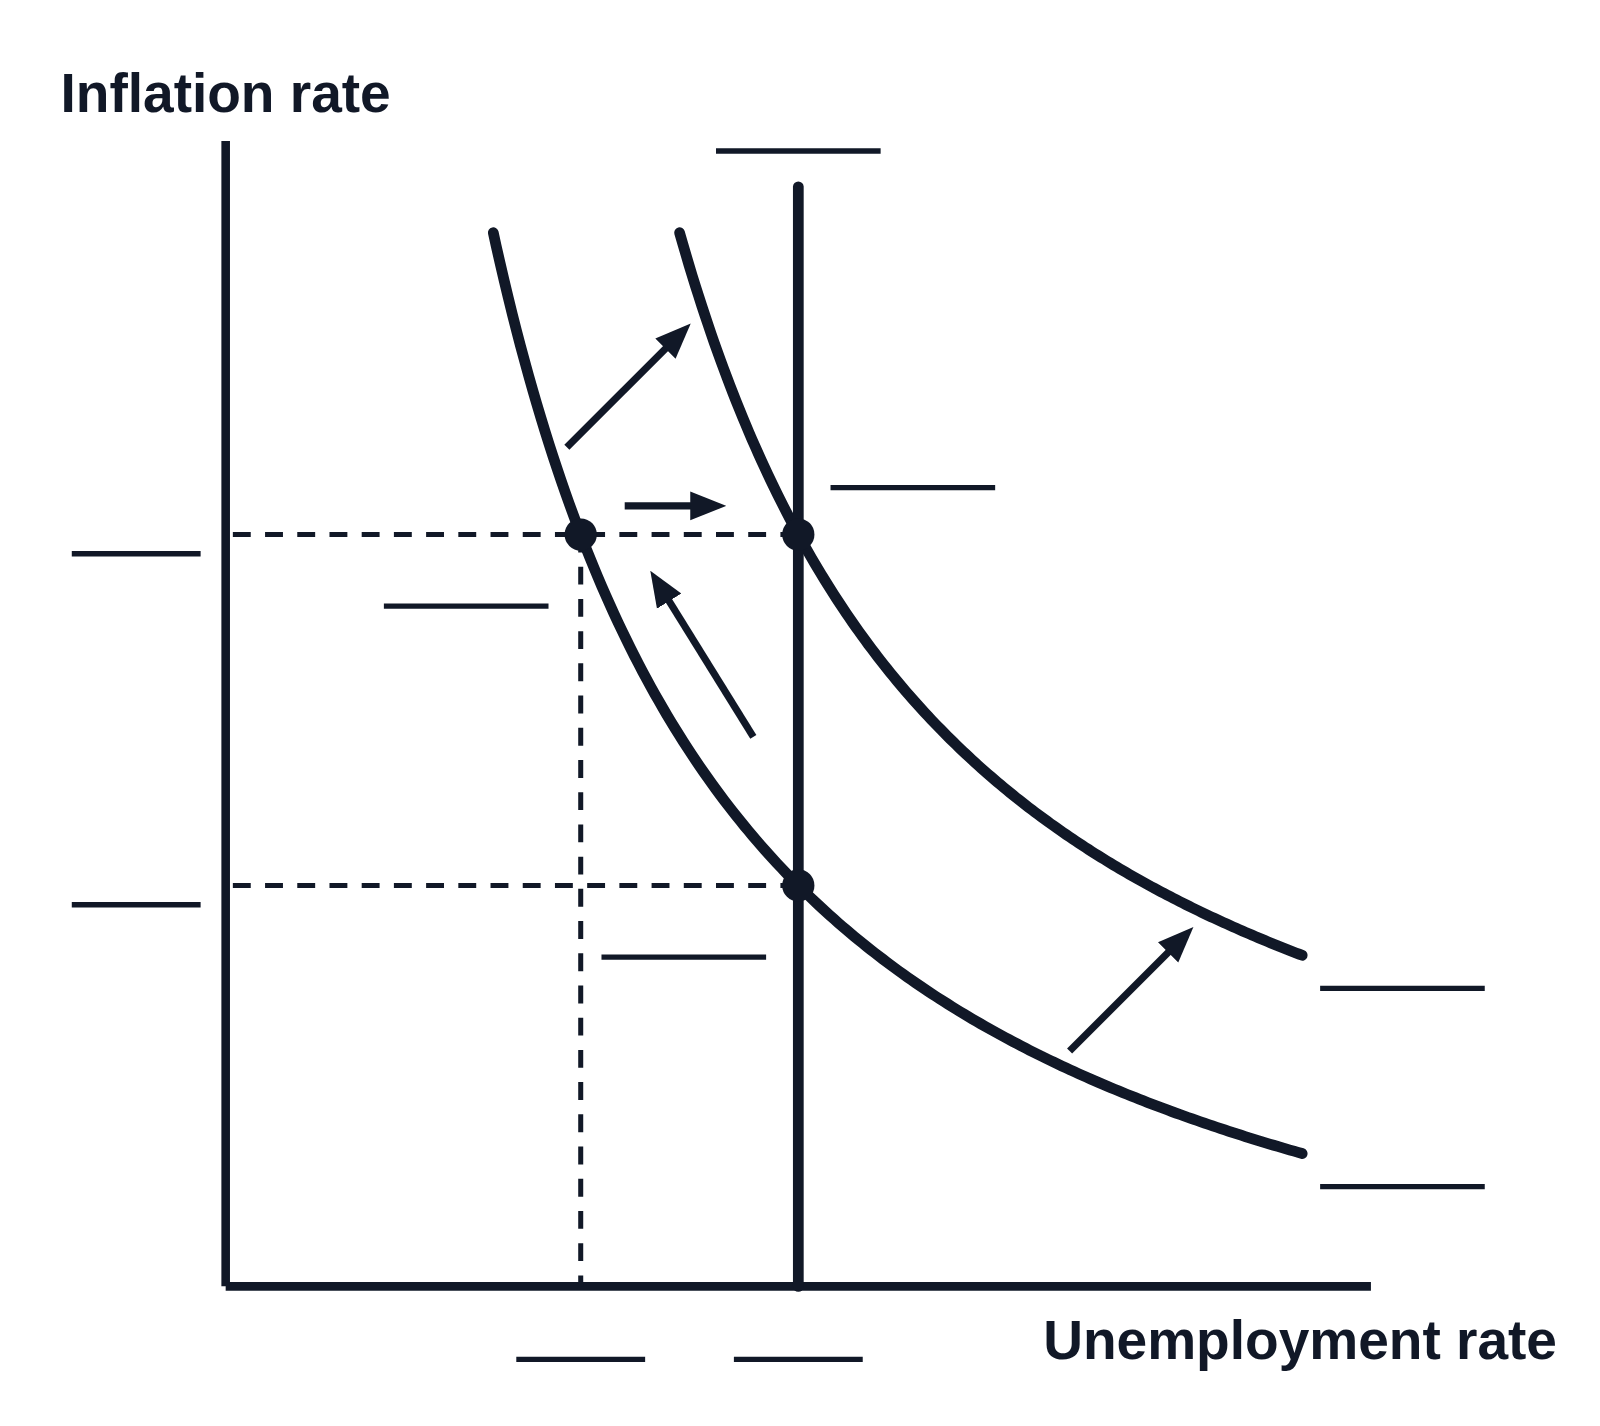
Phillips curve graph with no numbers on the axes: point A where the blue curve SRPC₁ crosses the vertical red LRPC; a black arrow up along SRPC₁ to point B, at lower unemployment and higher inflation; a second blue curve SRPC₂ above and to the right of SRPC₁, with two blue arrows from SRPC₁ to it; and a black arrow across from B to point C, where SRPC₂ crosses the LRPC. Dashed lines run from the points to the axes, labeled π₁ and π₂ on the inflation axis and u₁ and uₙ on the unemployment axis
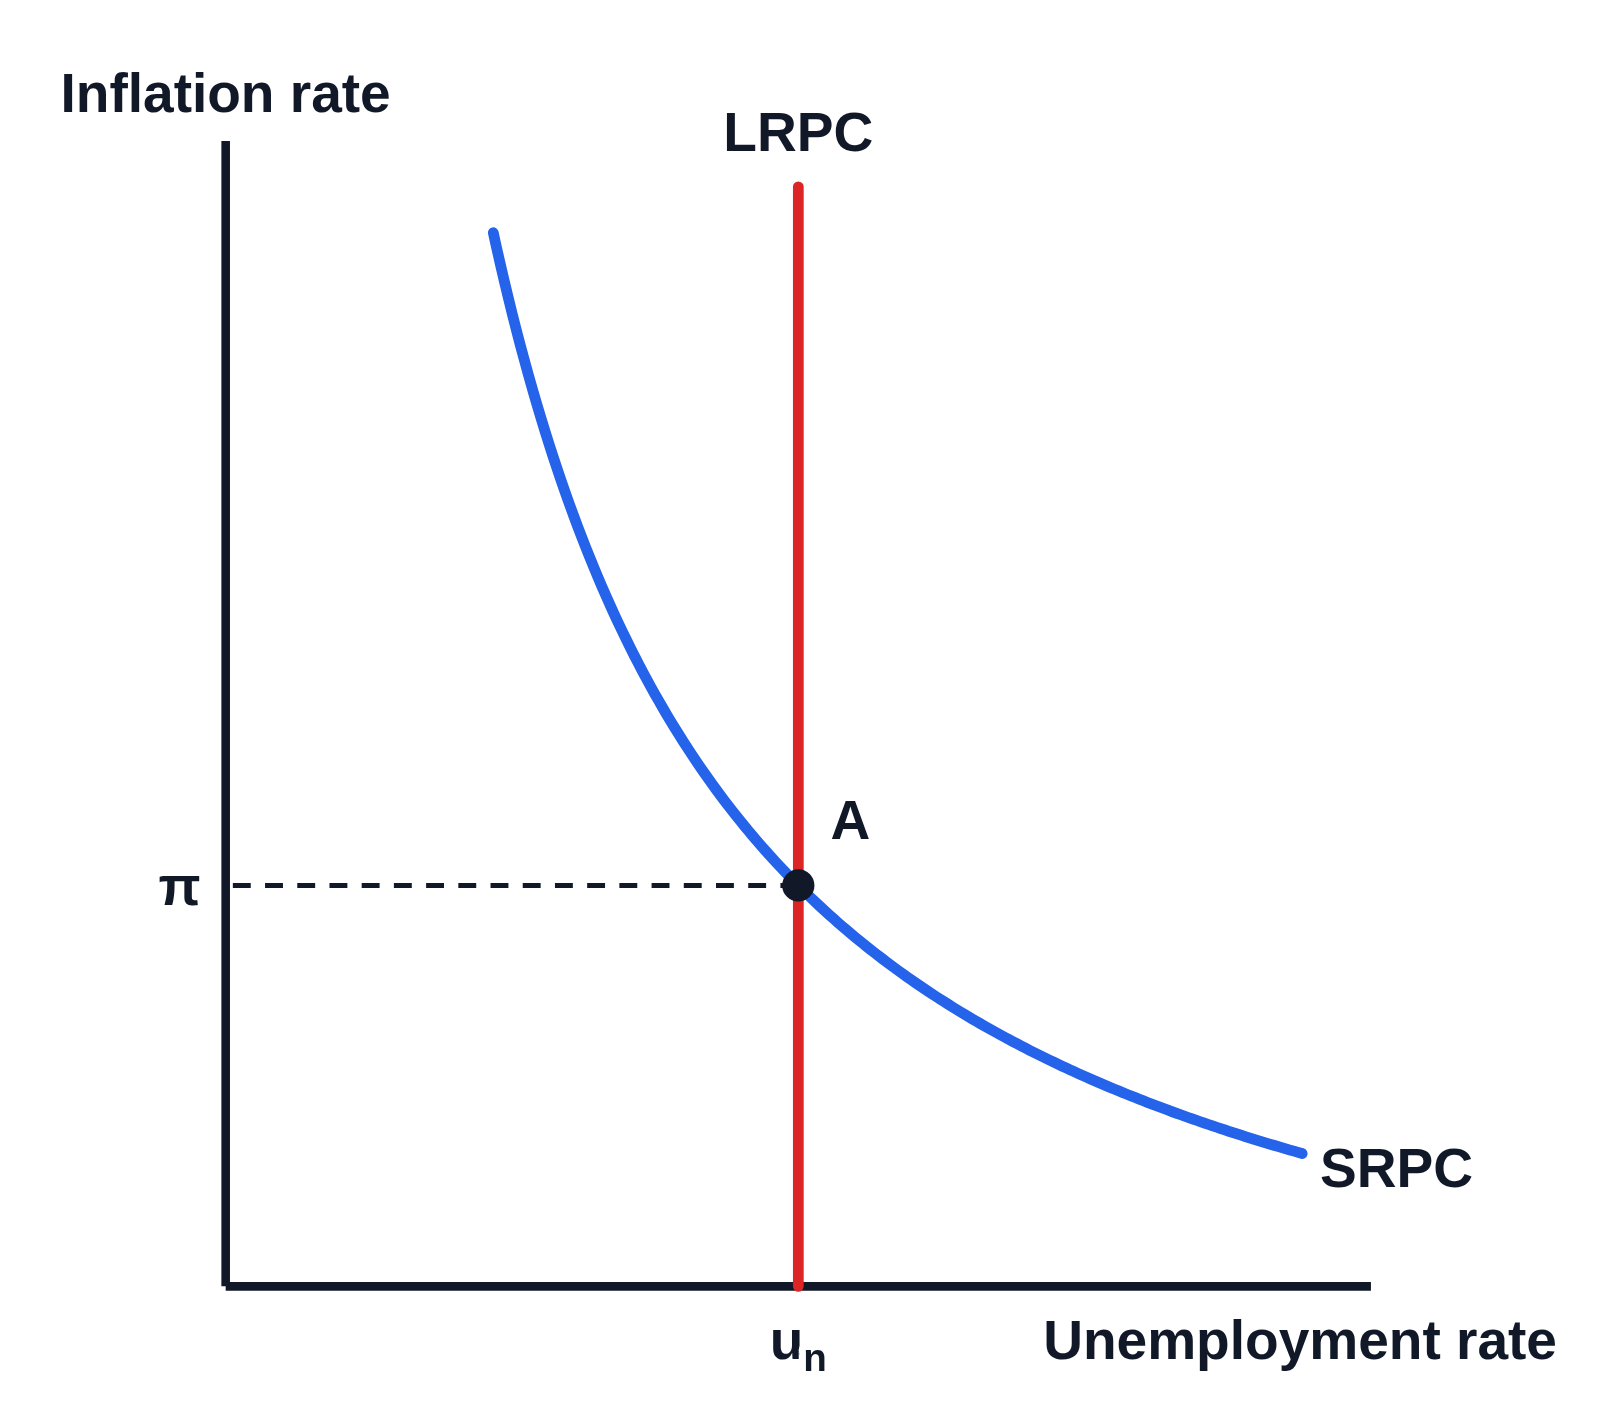
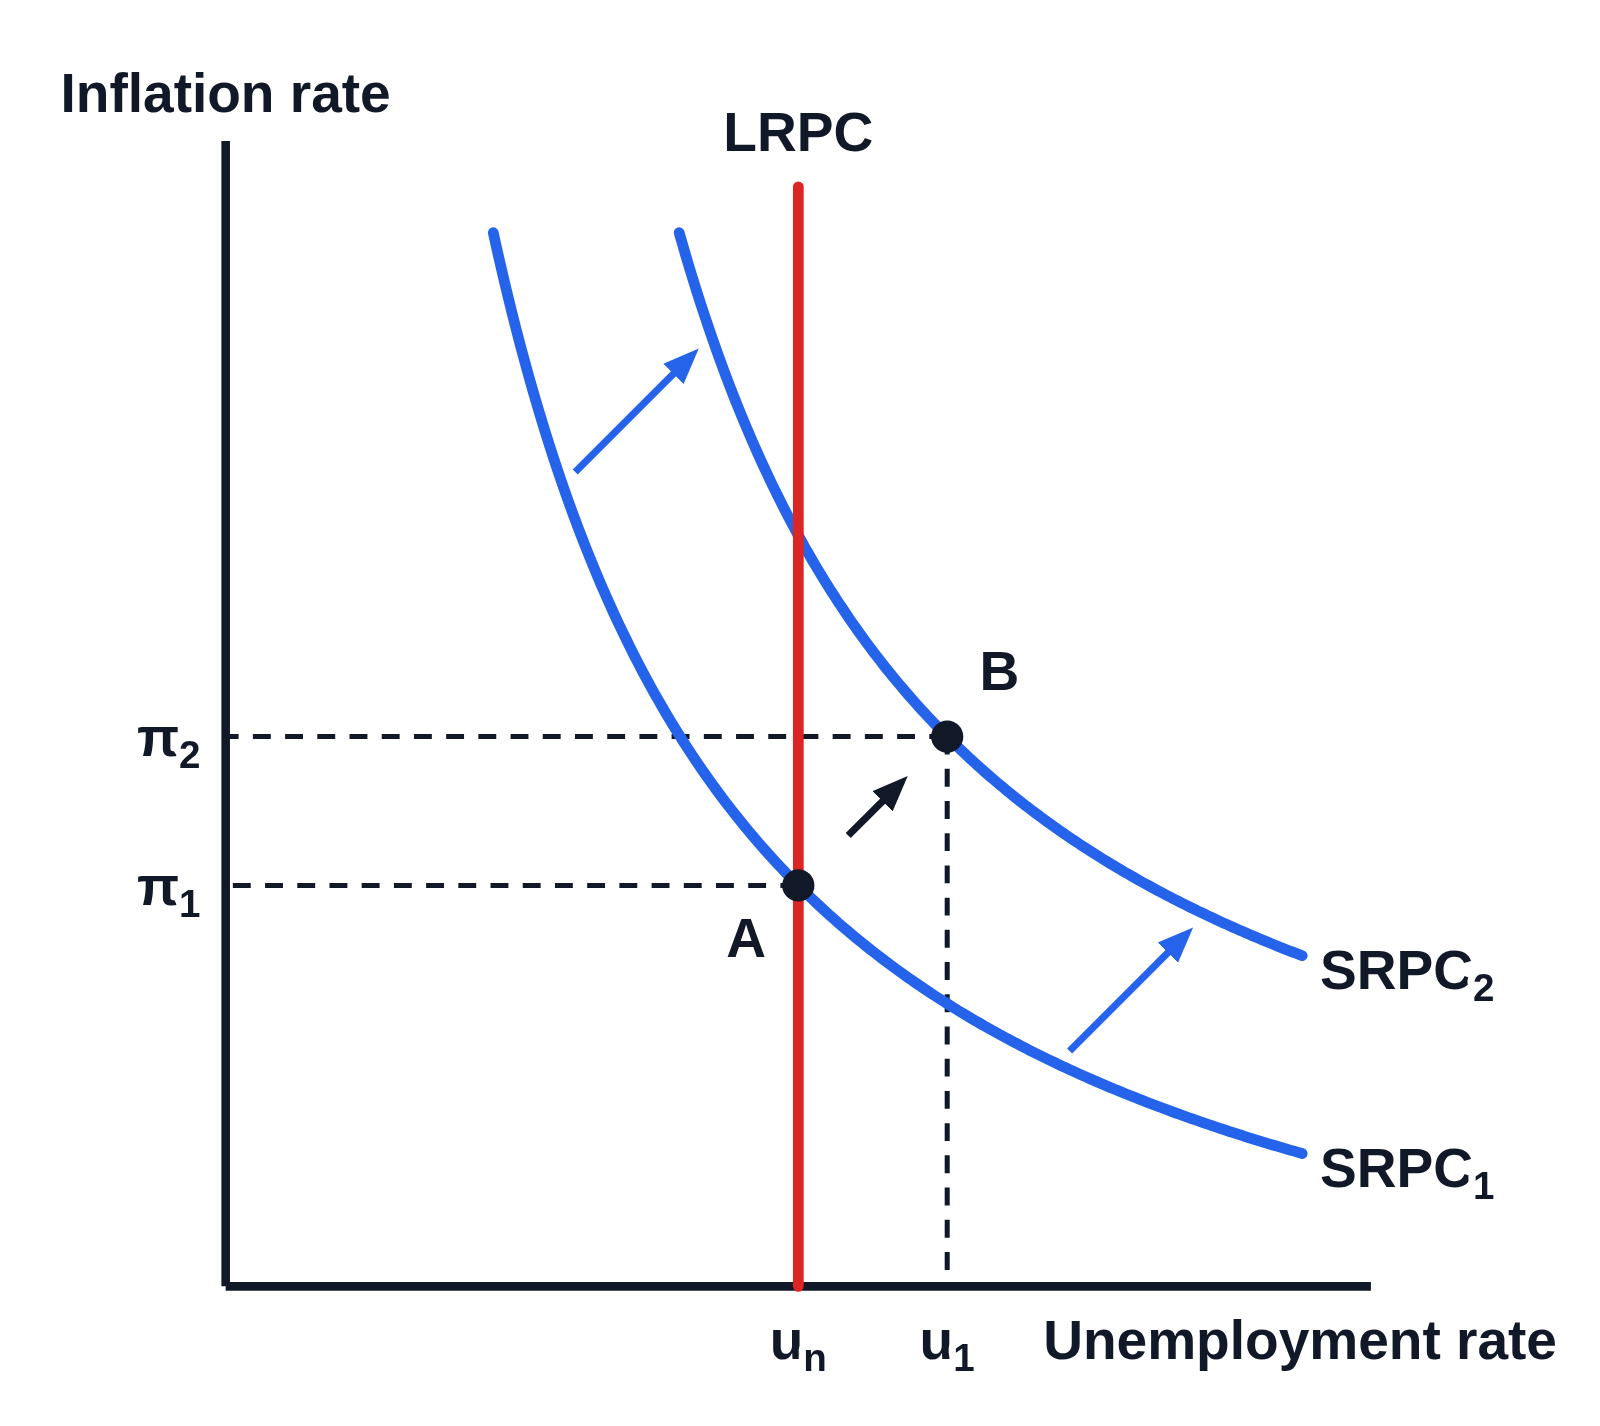
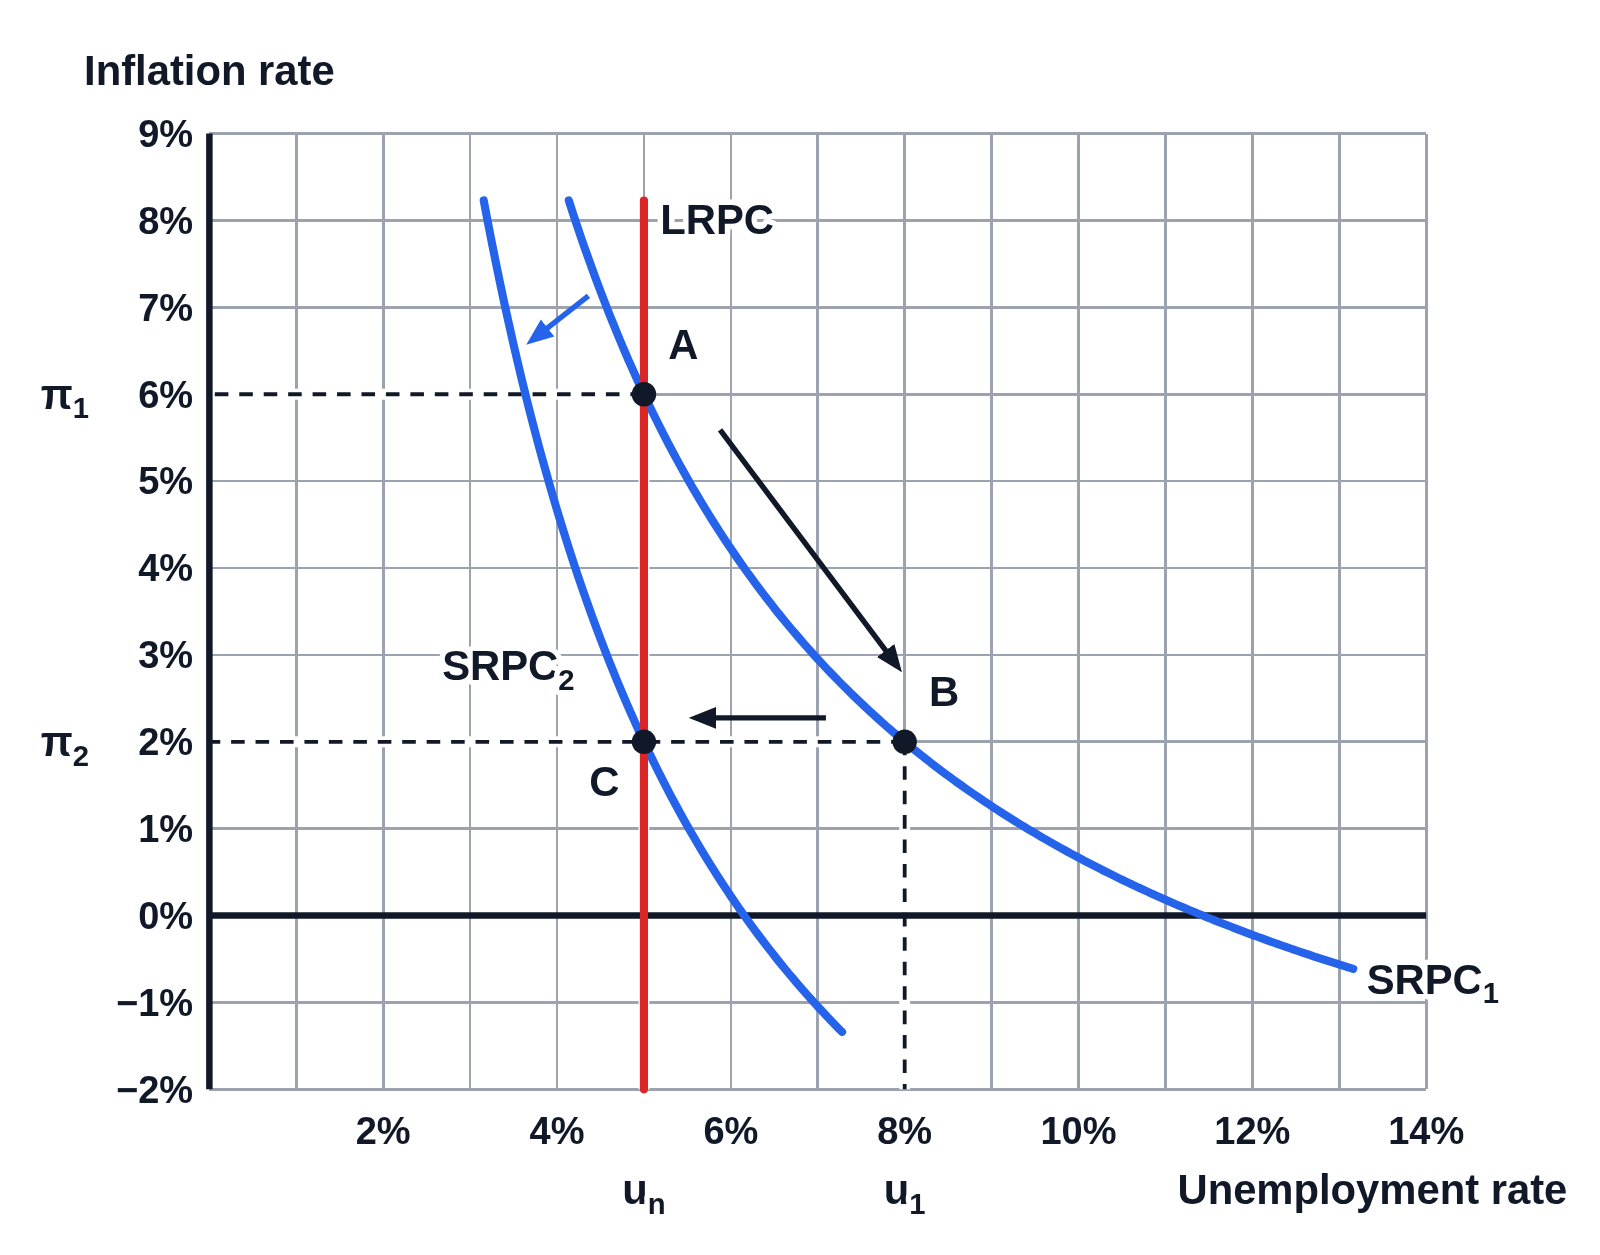
The economy starts at A, where the short-run Phillips curve SRPC₁ crosses the long-run Phillips curve (LRPC) at the natural rate uₙ, with inflation at π₁. It moves up along SRPC₁ to B, where unemployment has fallen to u₁ and inflation has risen to π₂. The SRPC then shifts up to SRPC₂, and the economy moves across to C on the LRPC, back at uₙ with inflation at π₂.

Editing opens it in Phillips Curve with these settings, to change anything and copy or download your own.

Free to use in your tests, worksheets, slides or anything else, no credit needed. Public domain under CC0 1.0. How to reuse our figures

More Phillips Curve examples