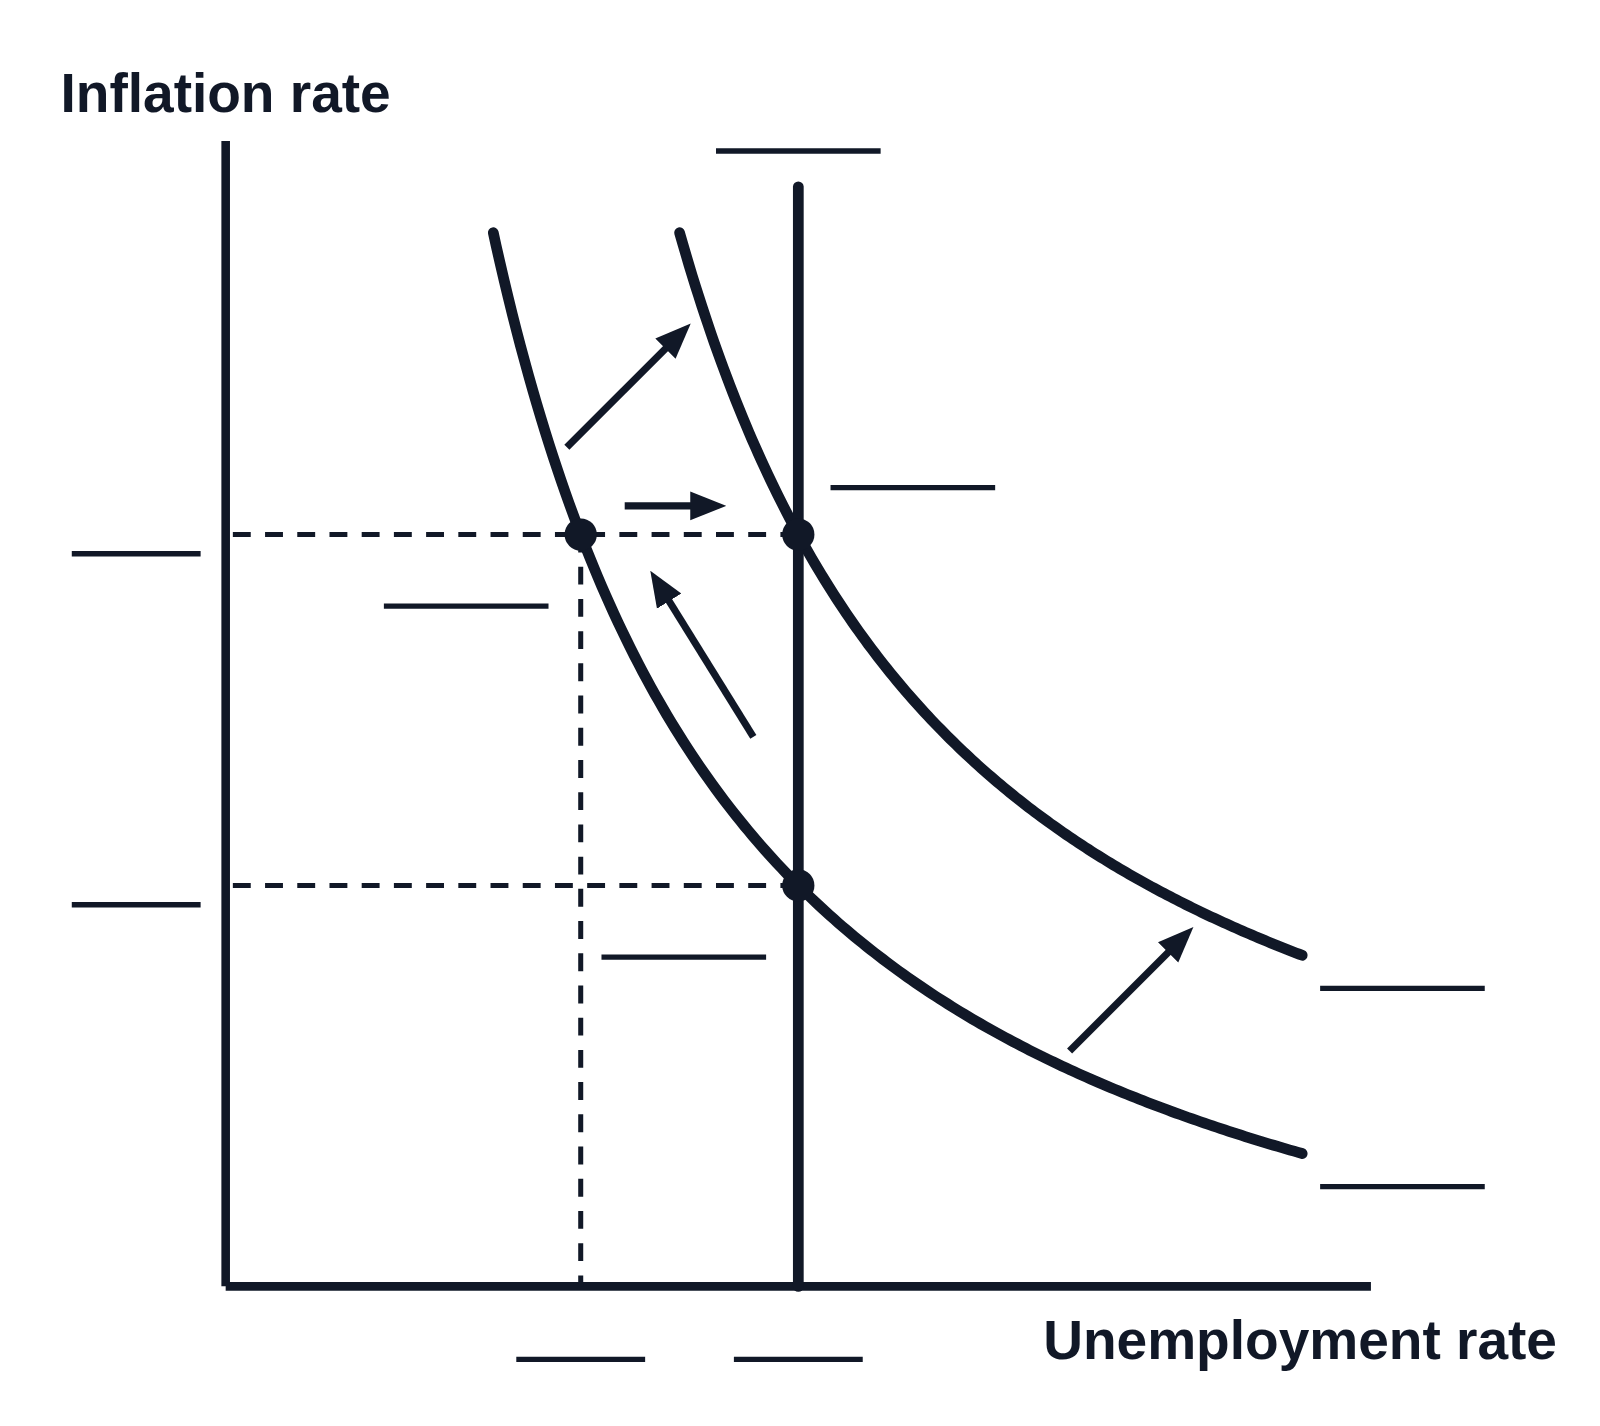
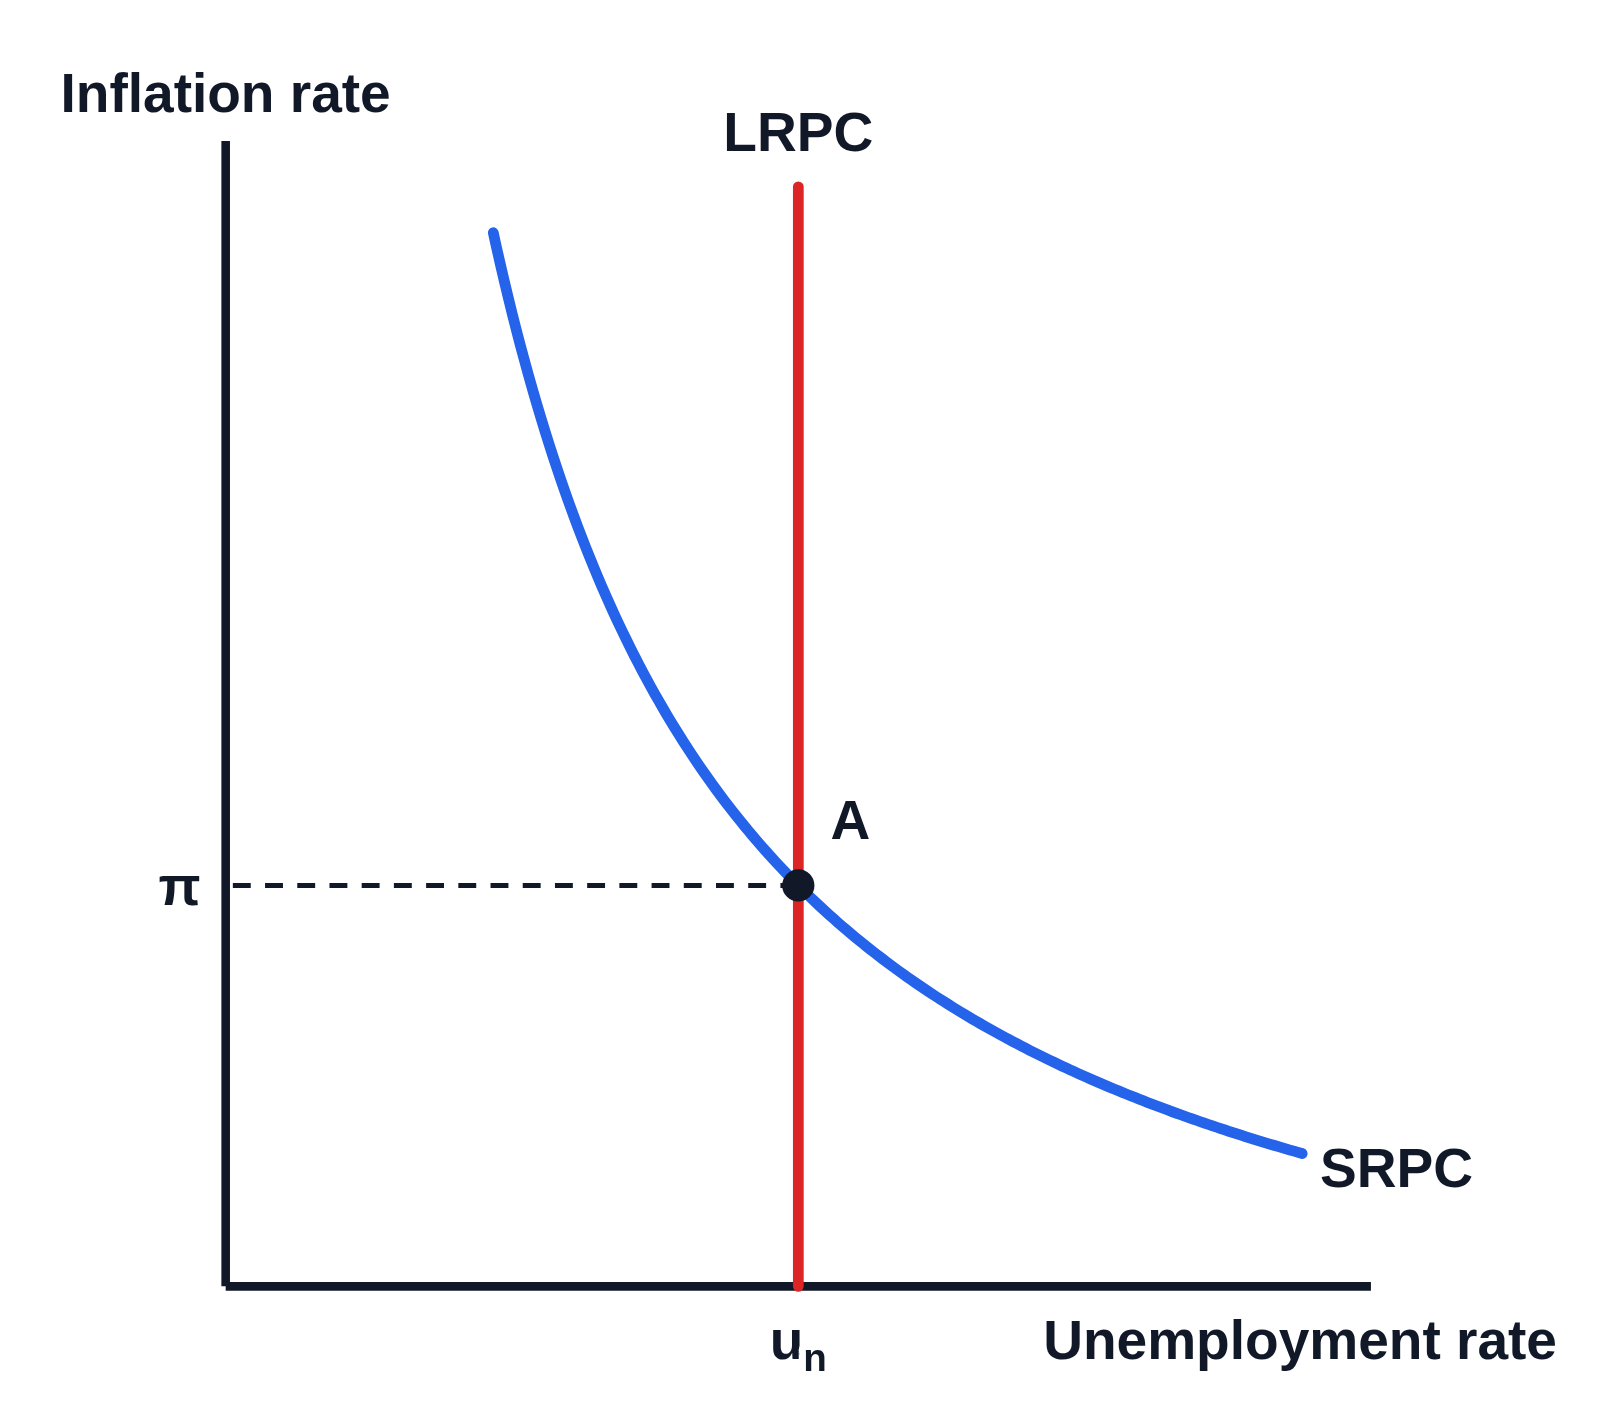
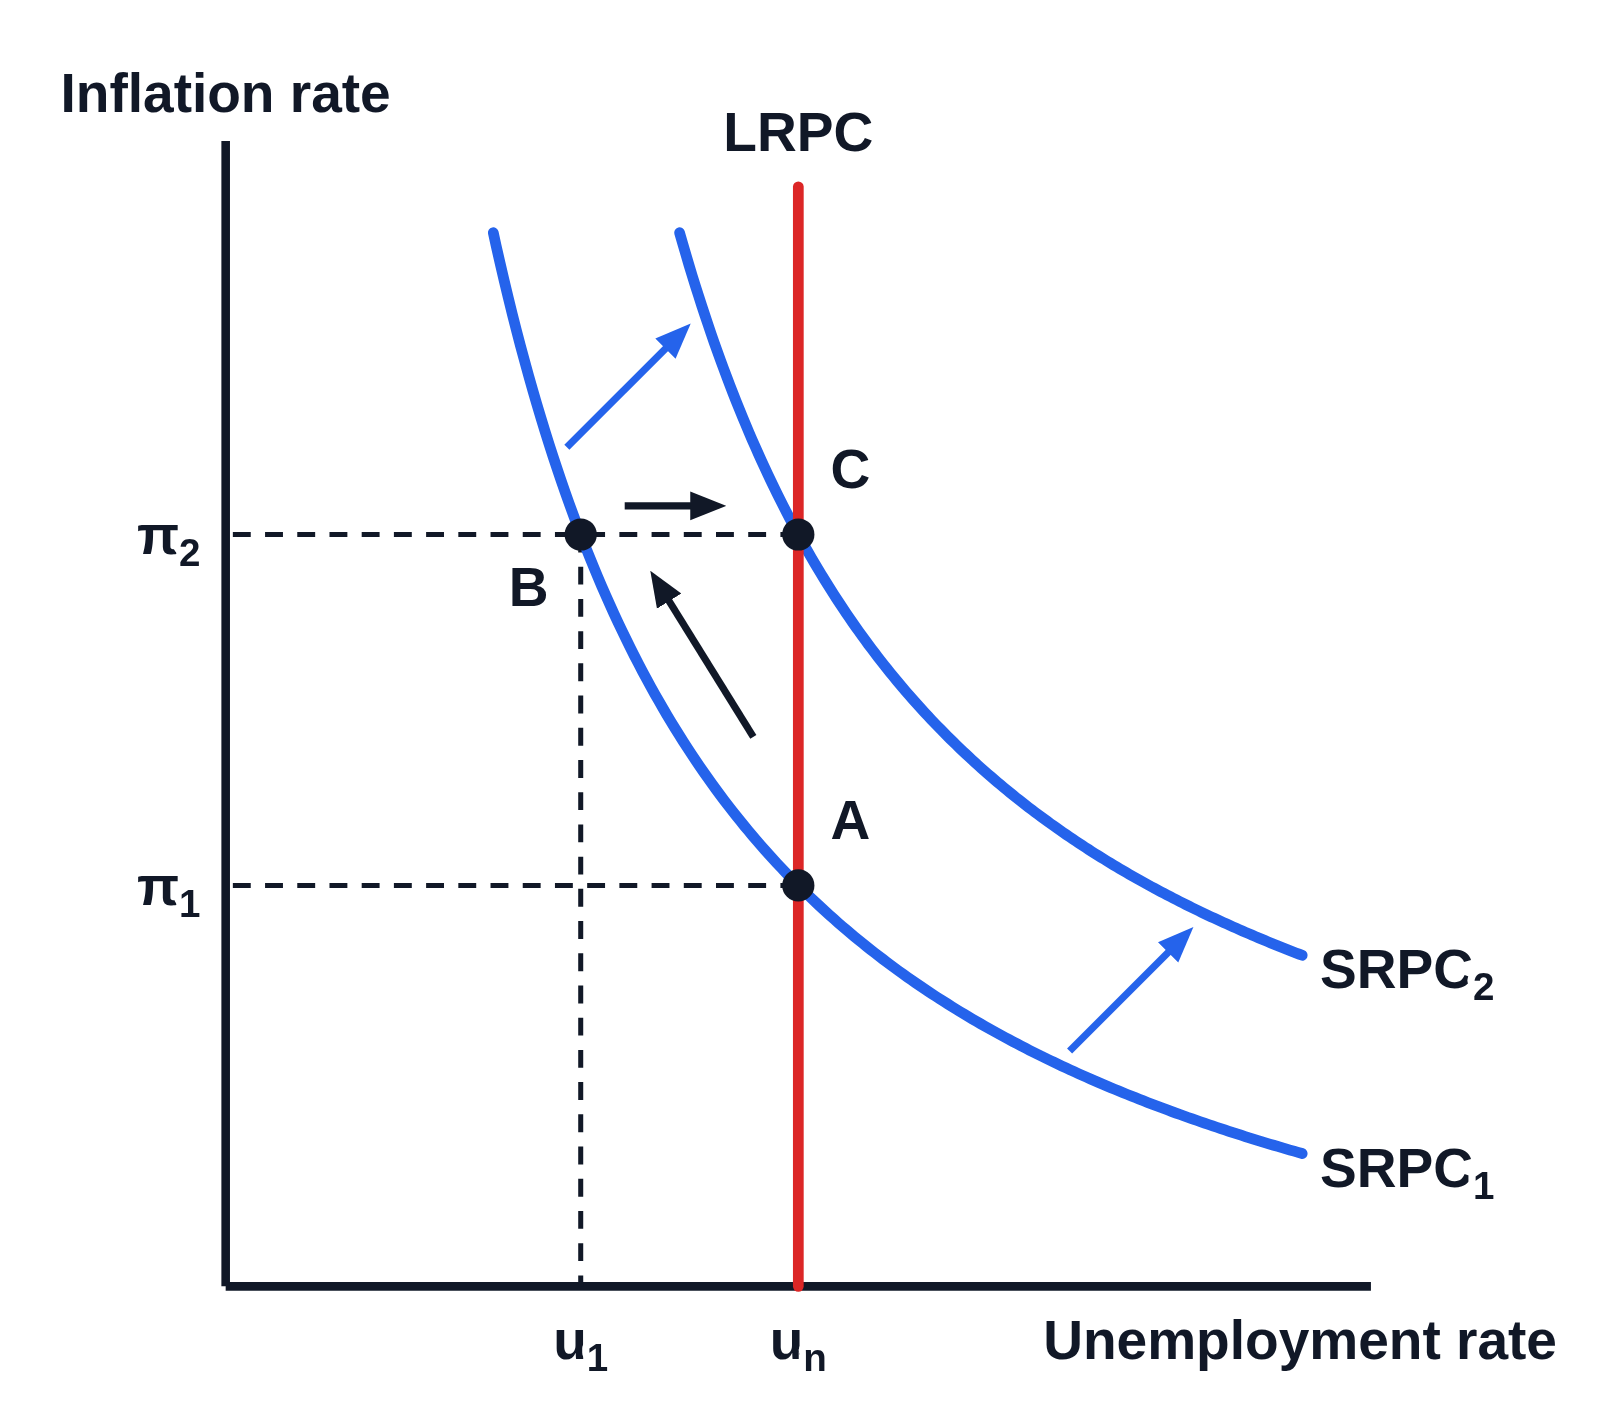
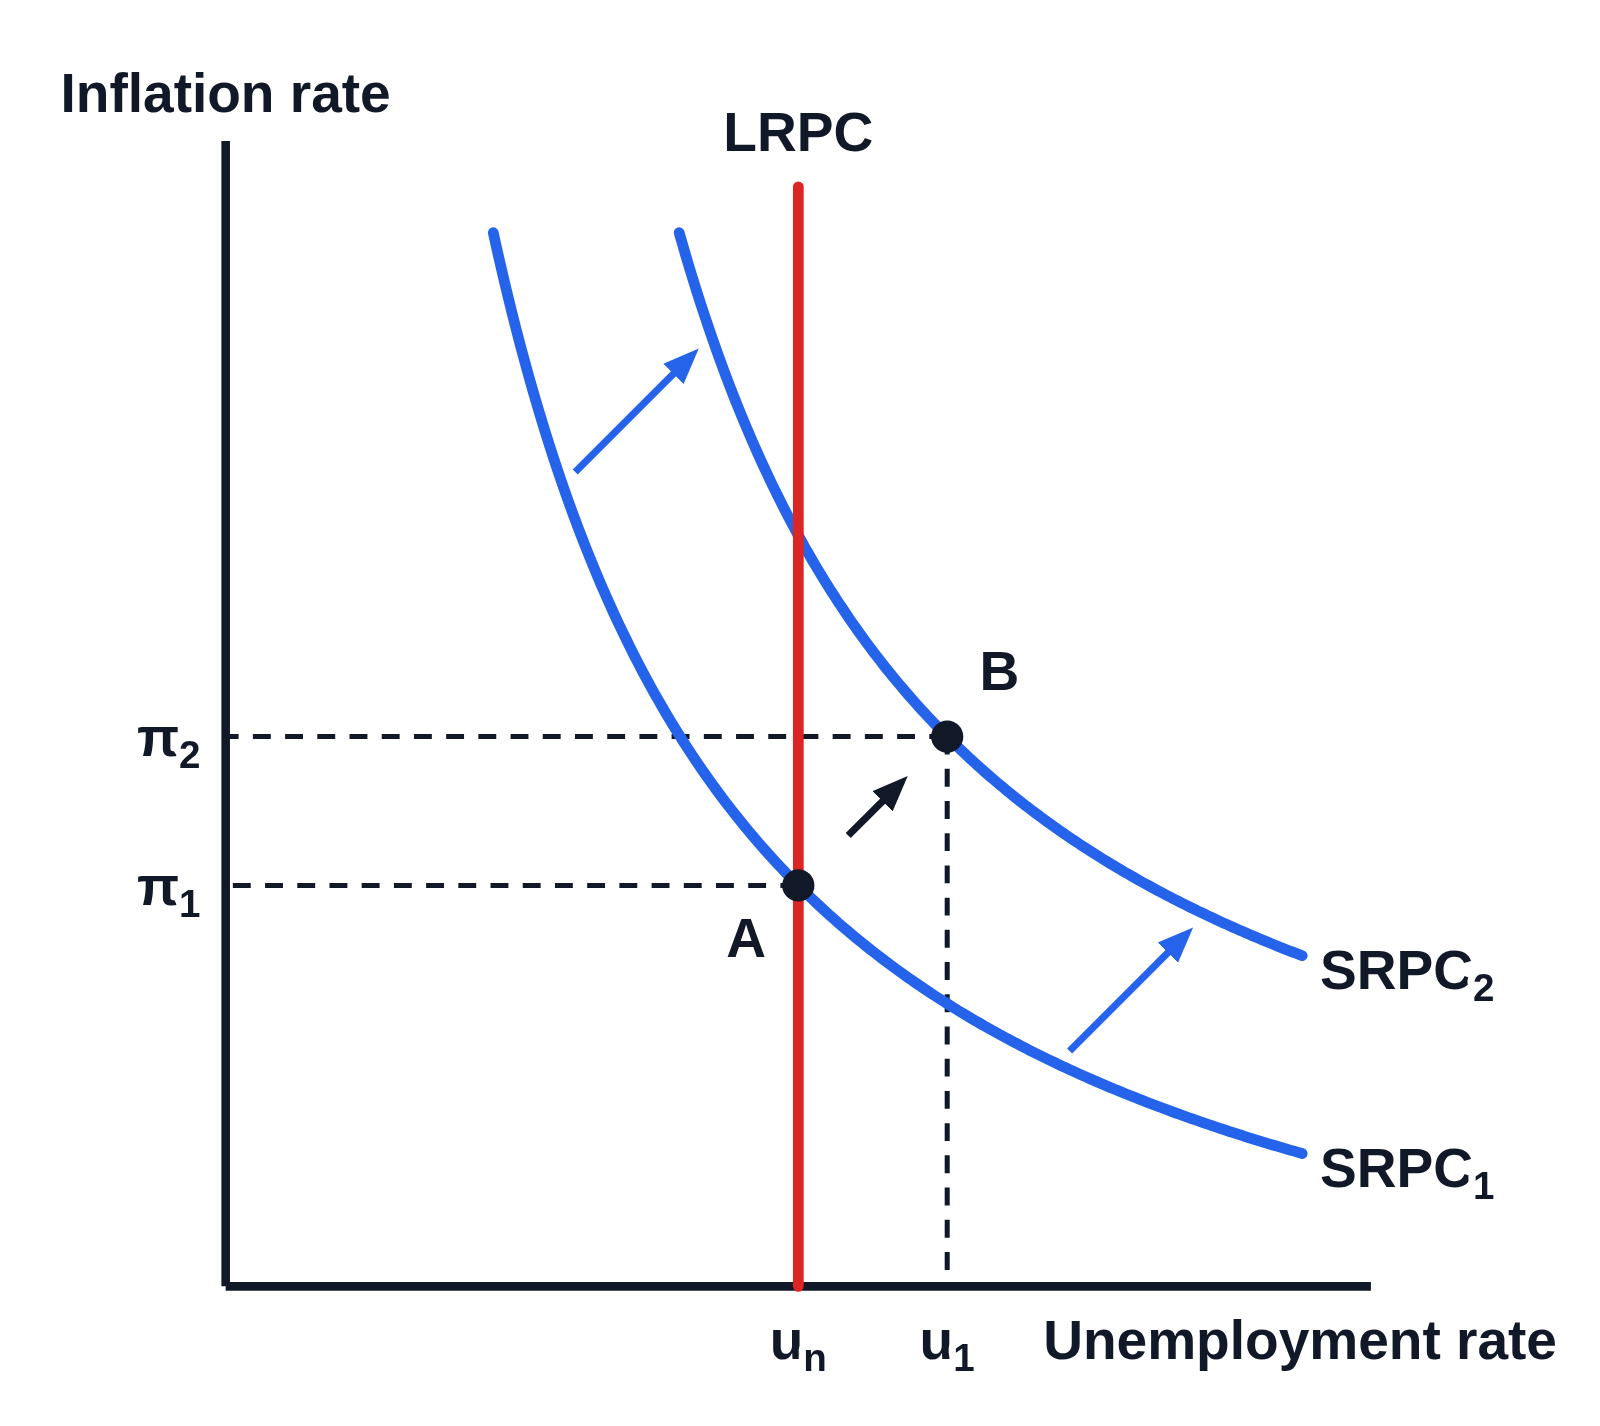
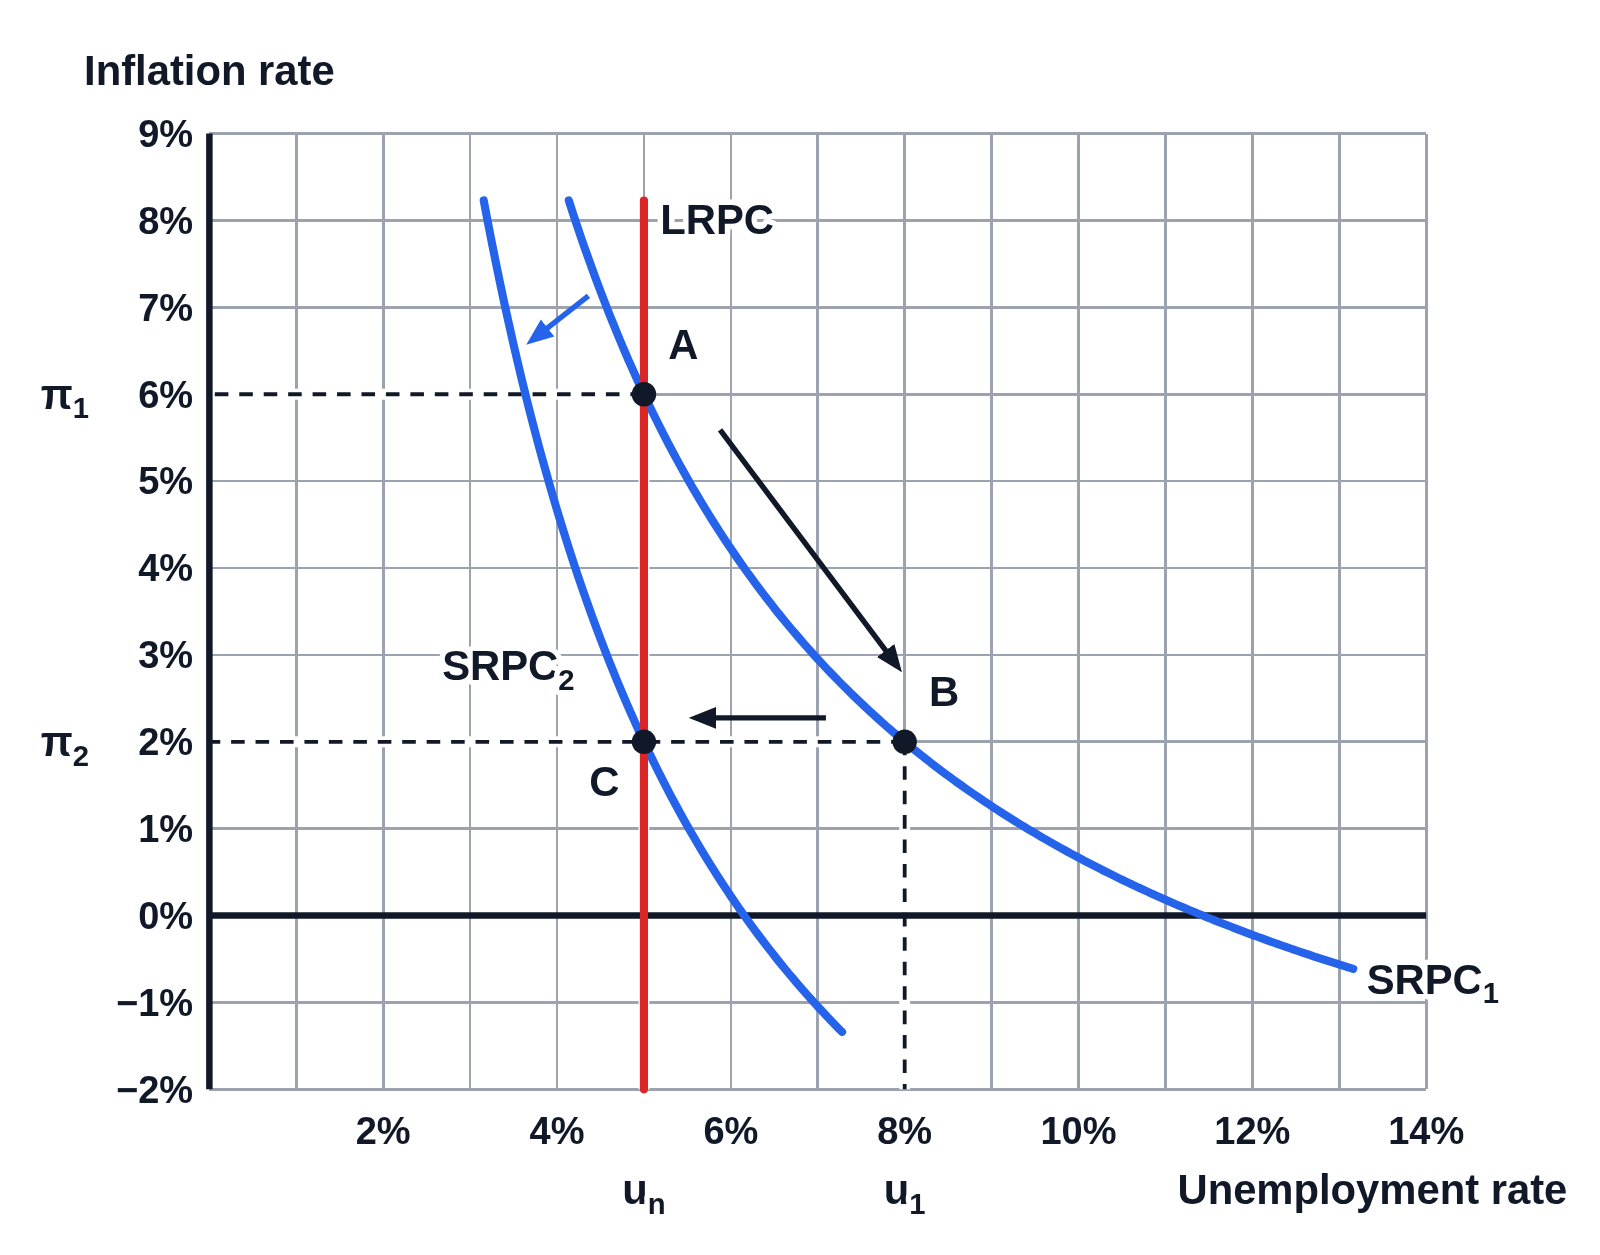
A worksheet version of the long-run adjustment graph, in black and white with no numbers on the axes. Two short-run Phillips curves, a vertical long-run Phillips curve, three points and dashed lines to the axes are drawn, with arrows from point to point and from one short-run curve to the other. Every curve name, point letter and rate at the axes is a blank line for students to fill in.