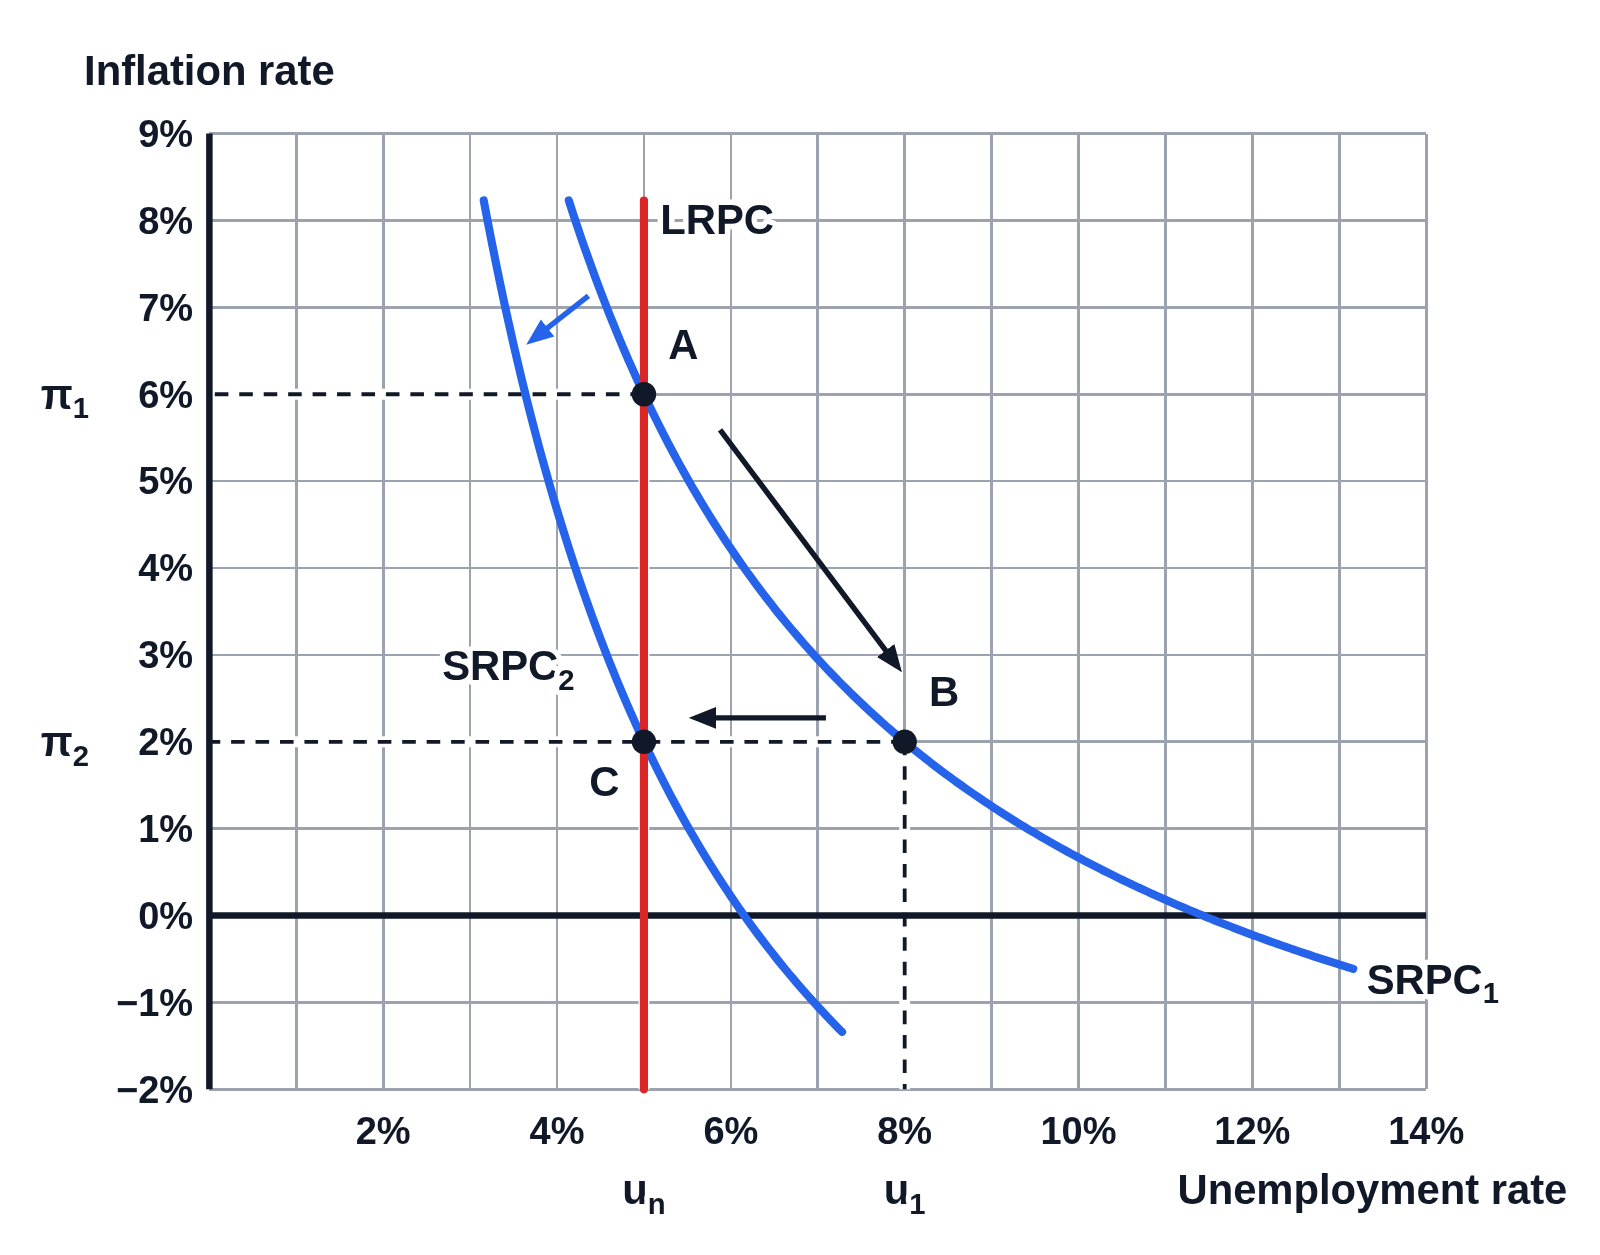
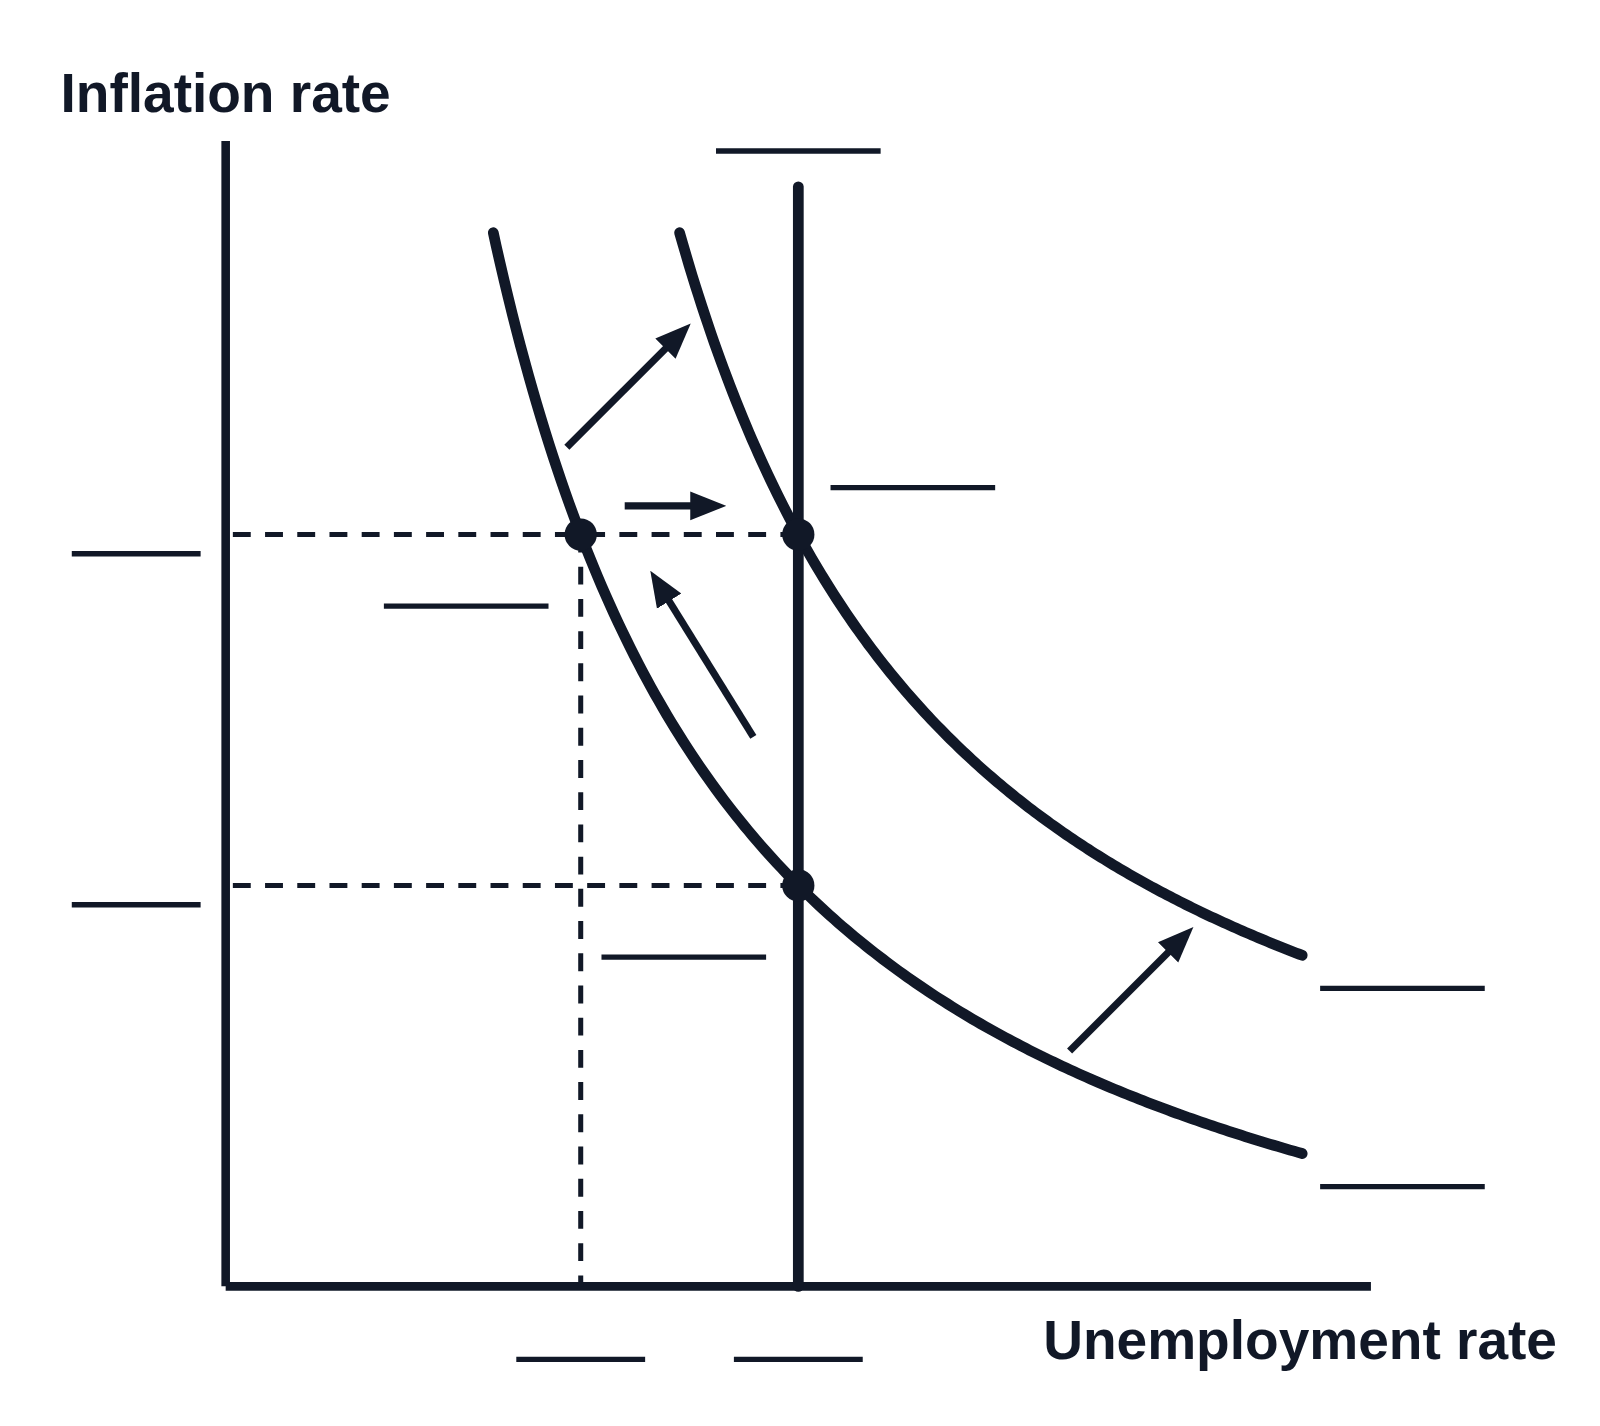
A Phillips curve graph on numbered axes, with percent signs on the numbers. The economy starts at A, 5% unemployment and 6% inflation, where the short-run Phillips curve SRPC₁ crosses the long-run Phillips curve (LRPC) at the natural rate of 5%. It moves down along SRPC₁ to B, 8% unemployment and 2% inflation, then the SRPC shifts down to SRPC₂ and the economy moves across to C, back at 5% unemployment with inflation at 2%. The inflation axis runs down to −2%, where SRPC₂ falls below 0% (deflation) at higher unemployment.