Price ceiling graph: shortage and deadweight loss

An example figure from the Supply and Demand generator.

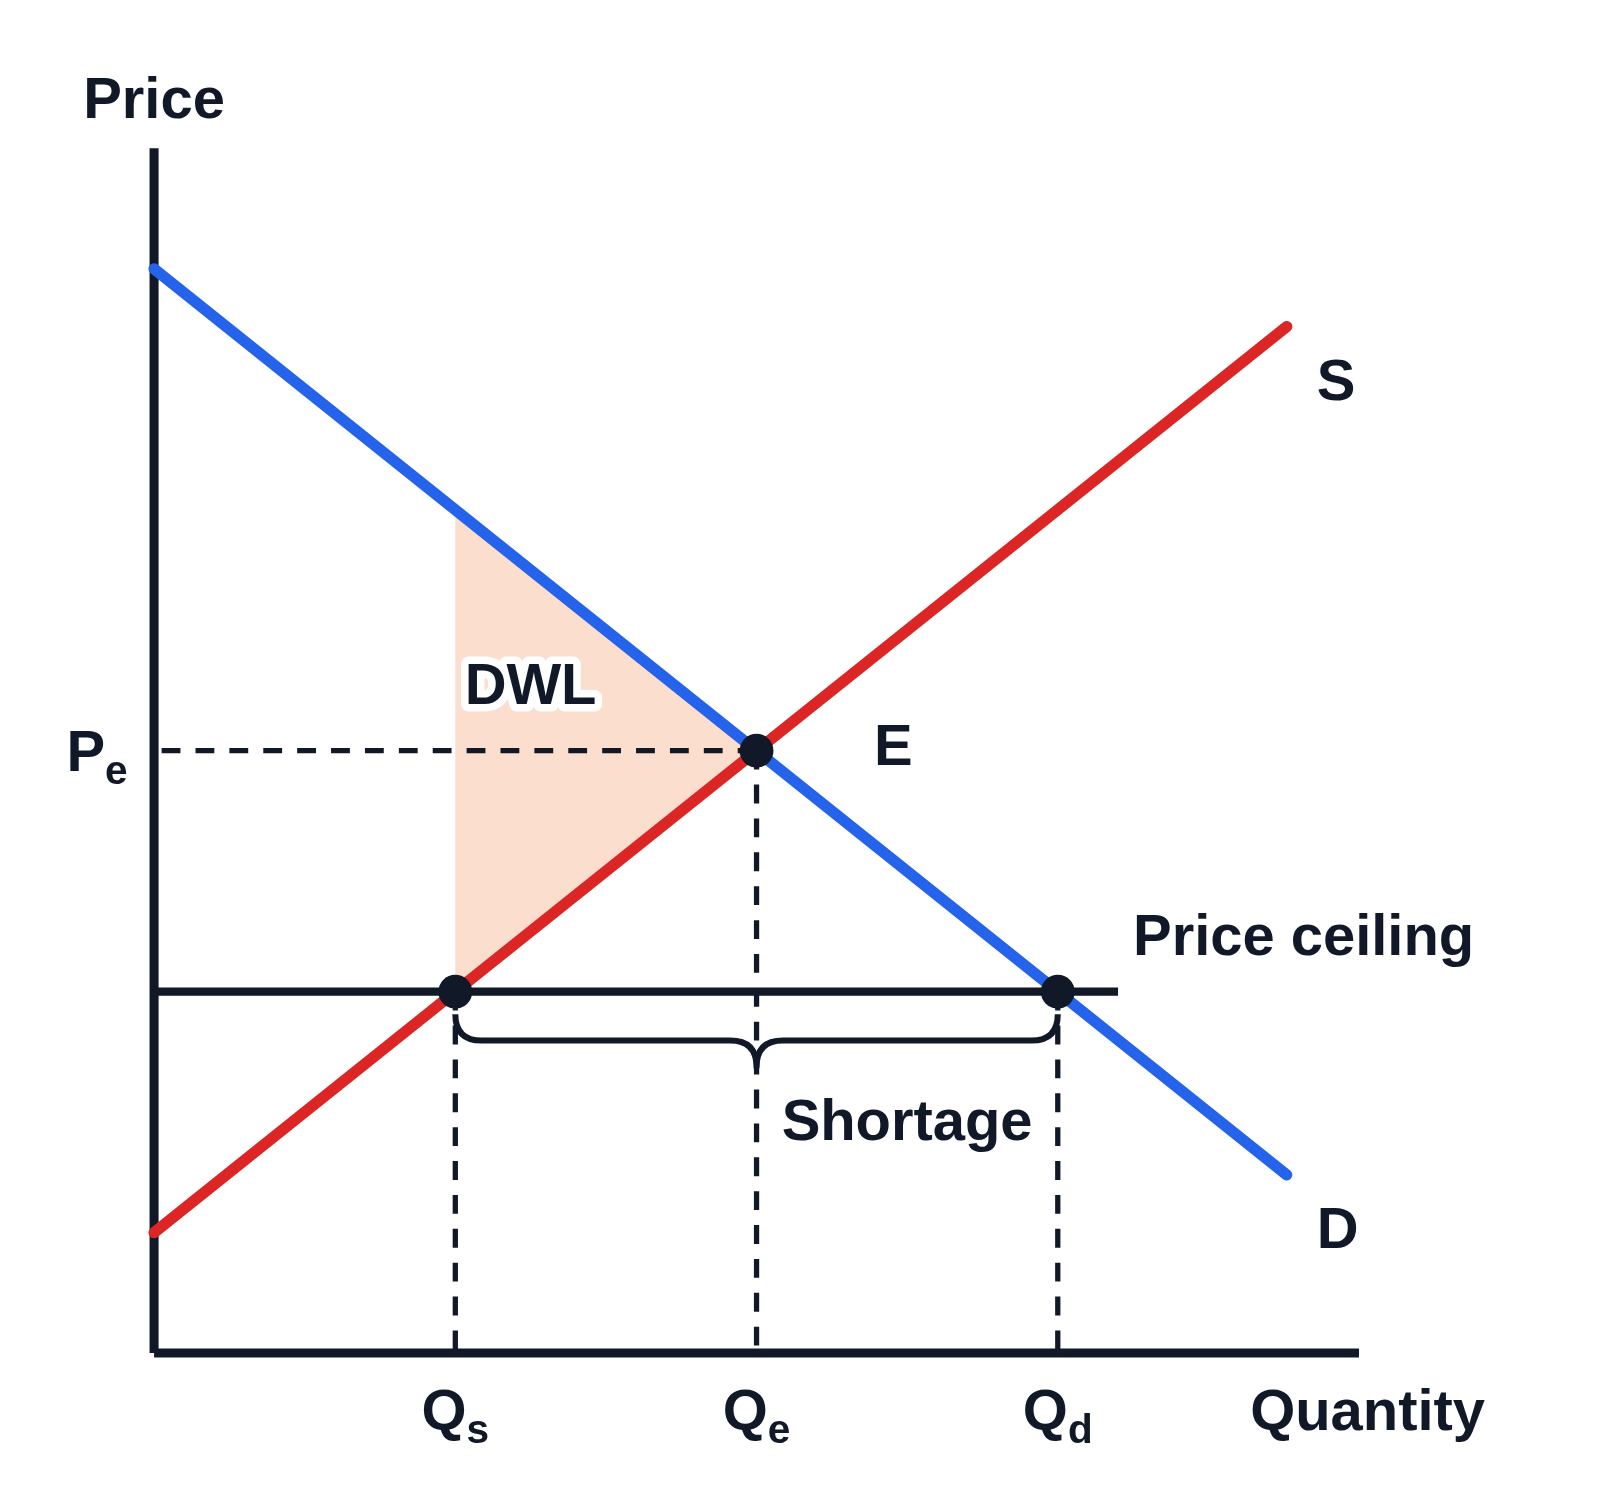
Supply and demand graph with no numbers on the axes, Price up the side and Quantity along the bottom: demand D and supply S crossing at E, with dashed lines to Pₑ and Qₑ. A horizontal line labeled Price ceiling runs below Pₑ, with dots where it meets S and D and dashed lines down to Qs and Qd, a brace under it between them labeled Shortage, and a shaded triangle between the curves from Qs to Qₑ labeled DWL
A binding price ceiling, set below the equilibrium price Pₑ. At the ceiling the quantity supplied Qs is less than the quantity demanded Qd, and the brace between them marks the shortage. The shaded triangle between the demand and supply curves, from Qs to the equilibrium quantity Qₑ, is the deadweight loss.

Editing opens it in Supply and Demand with these settings, to change anything and copy or download your own.

Free to use in your tests, worksheets, slides or anything else, no credit needed. Public domain under CC0 1.0. How to reuse our figures

More Supply and Demand examples