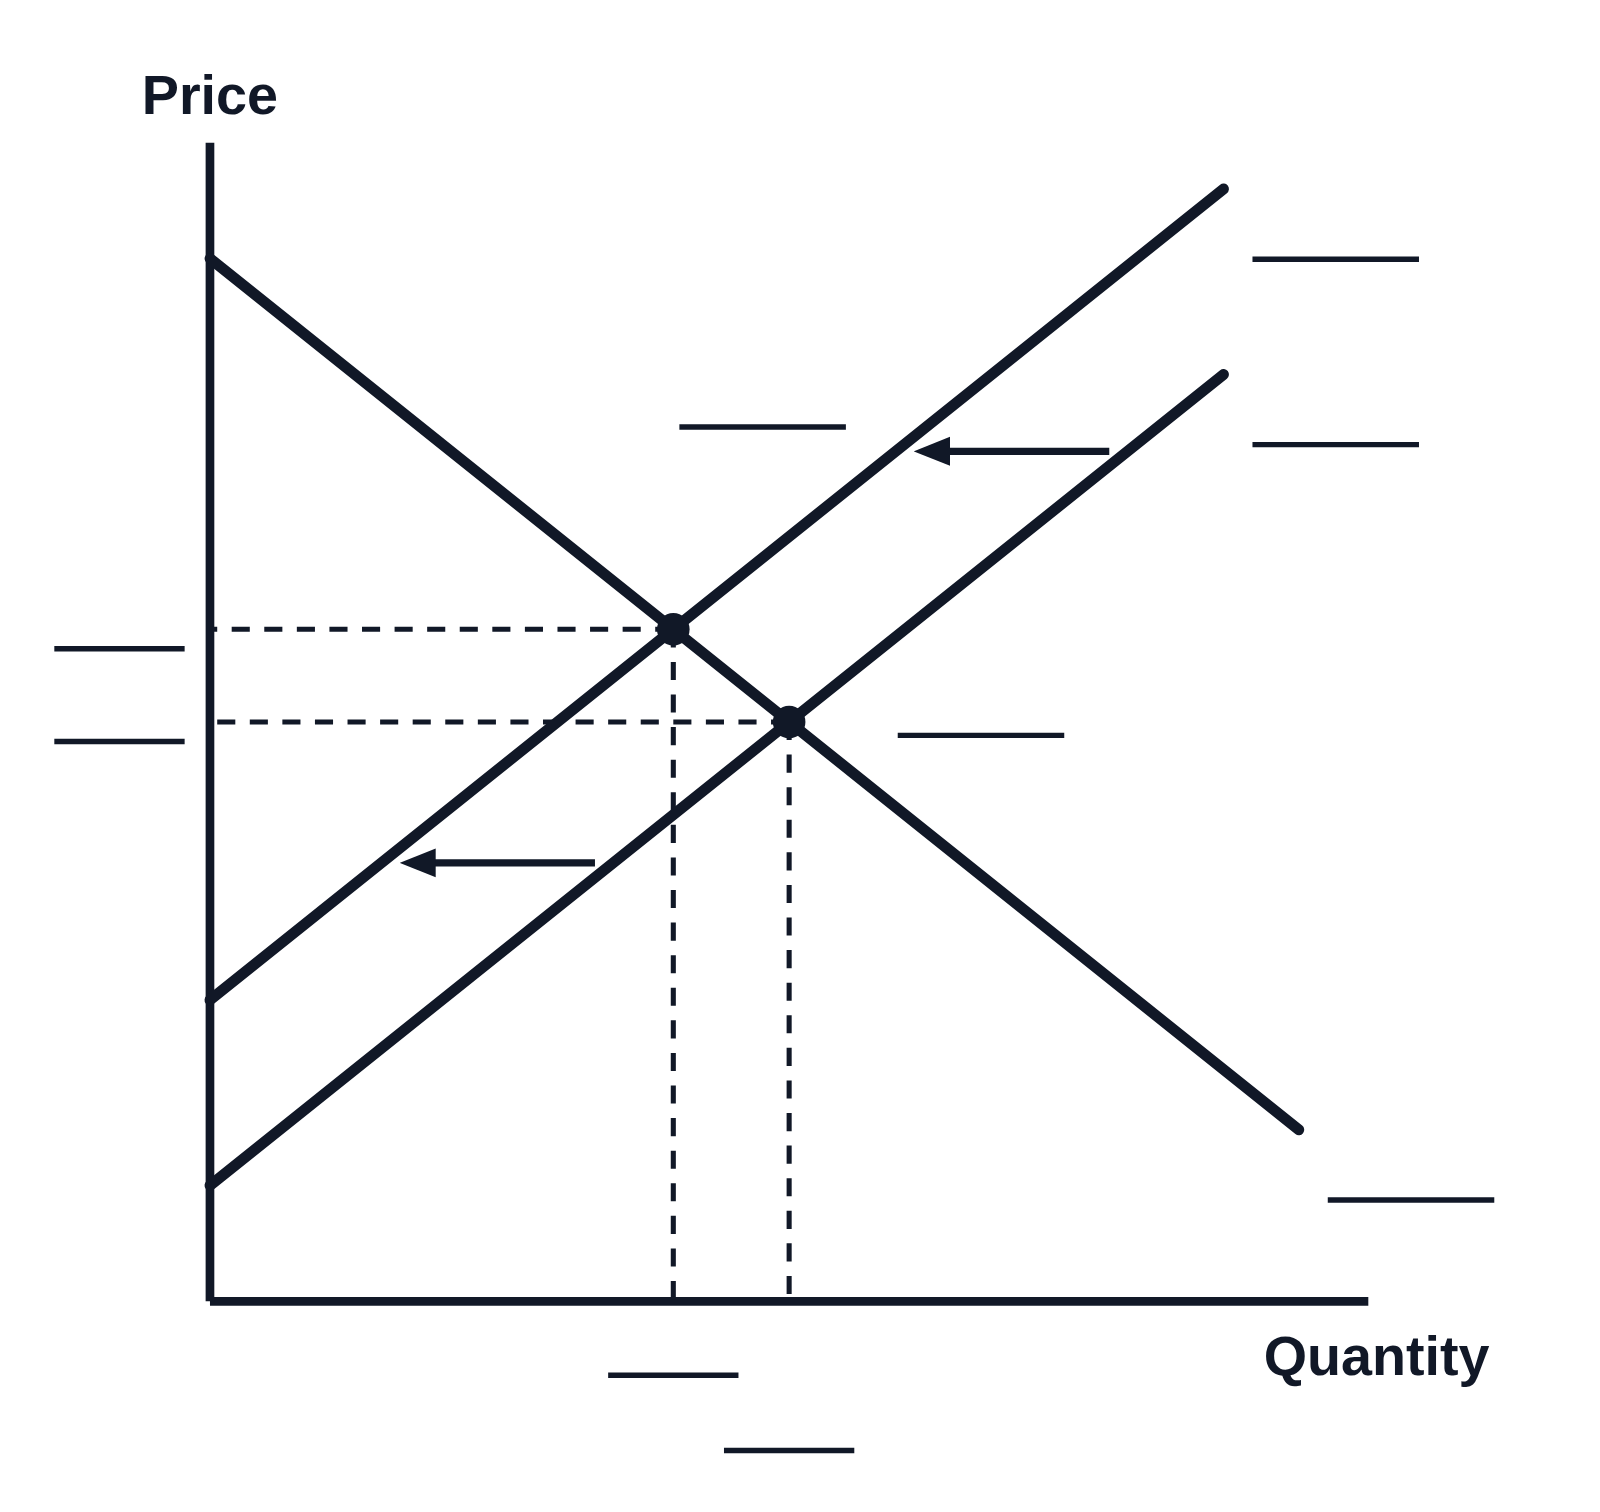
Supply and demand schedule graph with a price floor and surplus (numbered)

An example figure from the Supply and Demand generator.
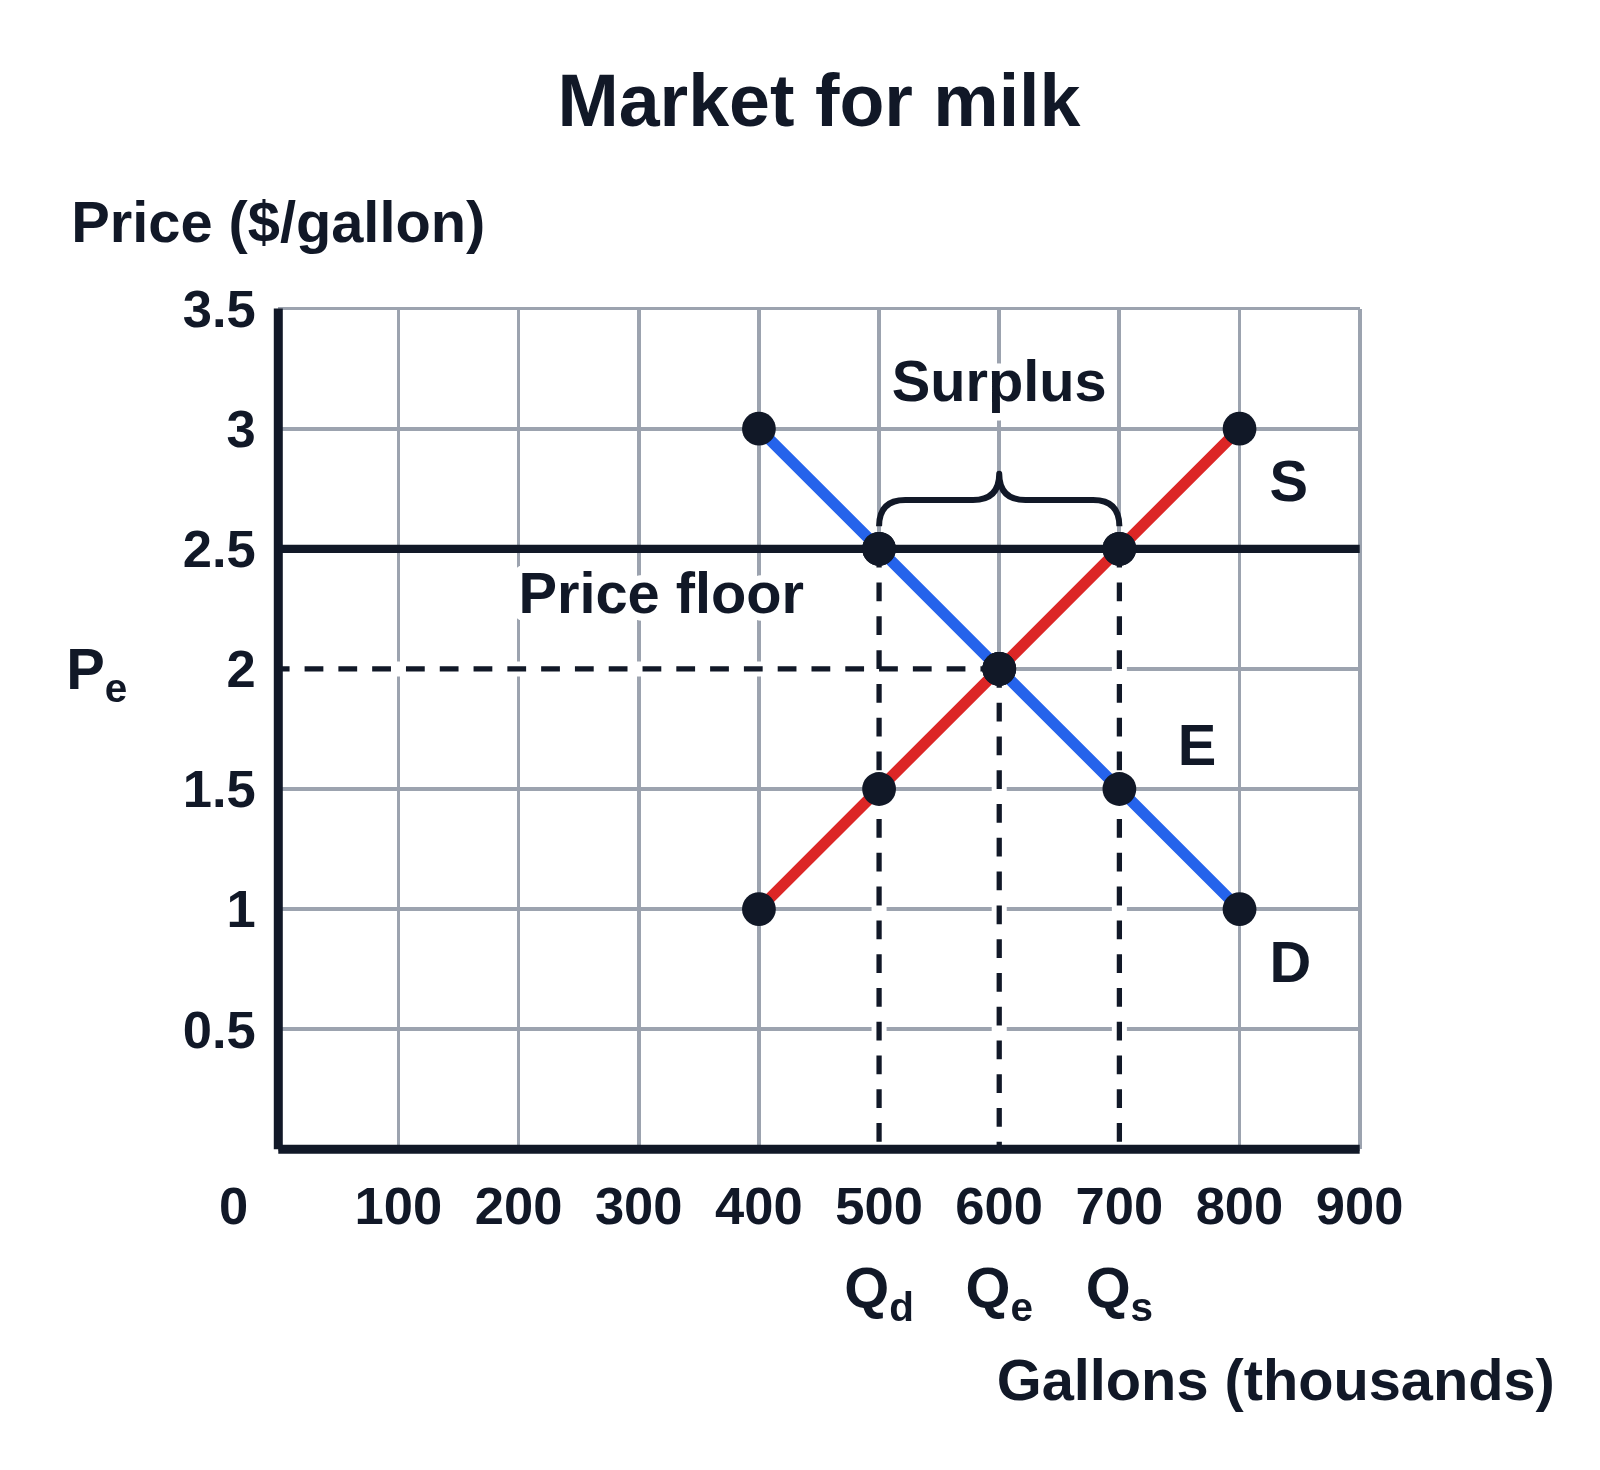
Numbered supply and demand graph titled Market for milk, Price ($/gallon) from 0 to 3.5 up the side and Gallons (thousands) from 0 to 900 along the bottom, with gridlines: demand D and supply S drawn through dots at each row of a schedule and crossing at E, with dashed lines to Pₑ at 2 and Qₑ at 600. A horizontal line labeled Price floor at 2.5 meets D at 500, marked Qd, and S at 700, marked Qs, with a brace above it between them labeled Surplus
A supply and demand graph numbered from a schedule for the market for milk, with demand and supply plotted as dots at prices from $1 to $3 a gallon. The curves cross at an equilibrium price of $2 and a quantity of 600 thousand gallons. A price floor at $2.50 makes the quantity supplied, 700 thousand gallons, greater than the quantity demanded, 500 thousand, a surplus of 200 thousand gallons marked by the brace.

Editing opens it in Supply and Demand with these settings, to change anything and copy or download your own.

Values

  • Equilibrium: price 2, quantity 600
  • Surplus of 200: 500 demanded, 700 supplied

Free to use in your tests, worksheets, slides or anything else, no credit needed. Public domain under CC0 1.0. How to reuse our figures
More Supply and Demand examples