Supply and demand worksheet: label a decrease in supply

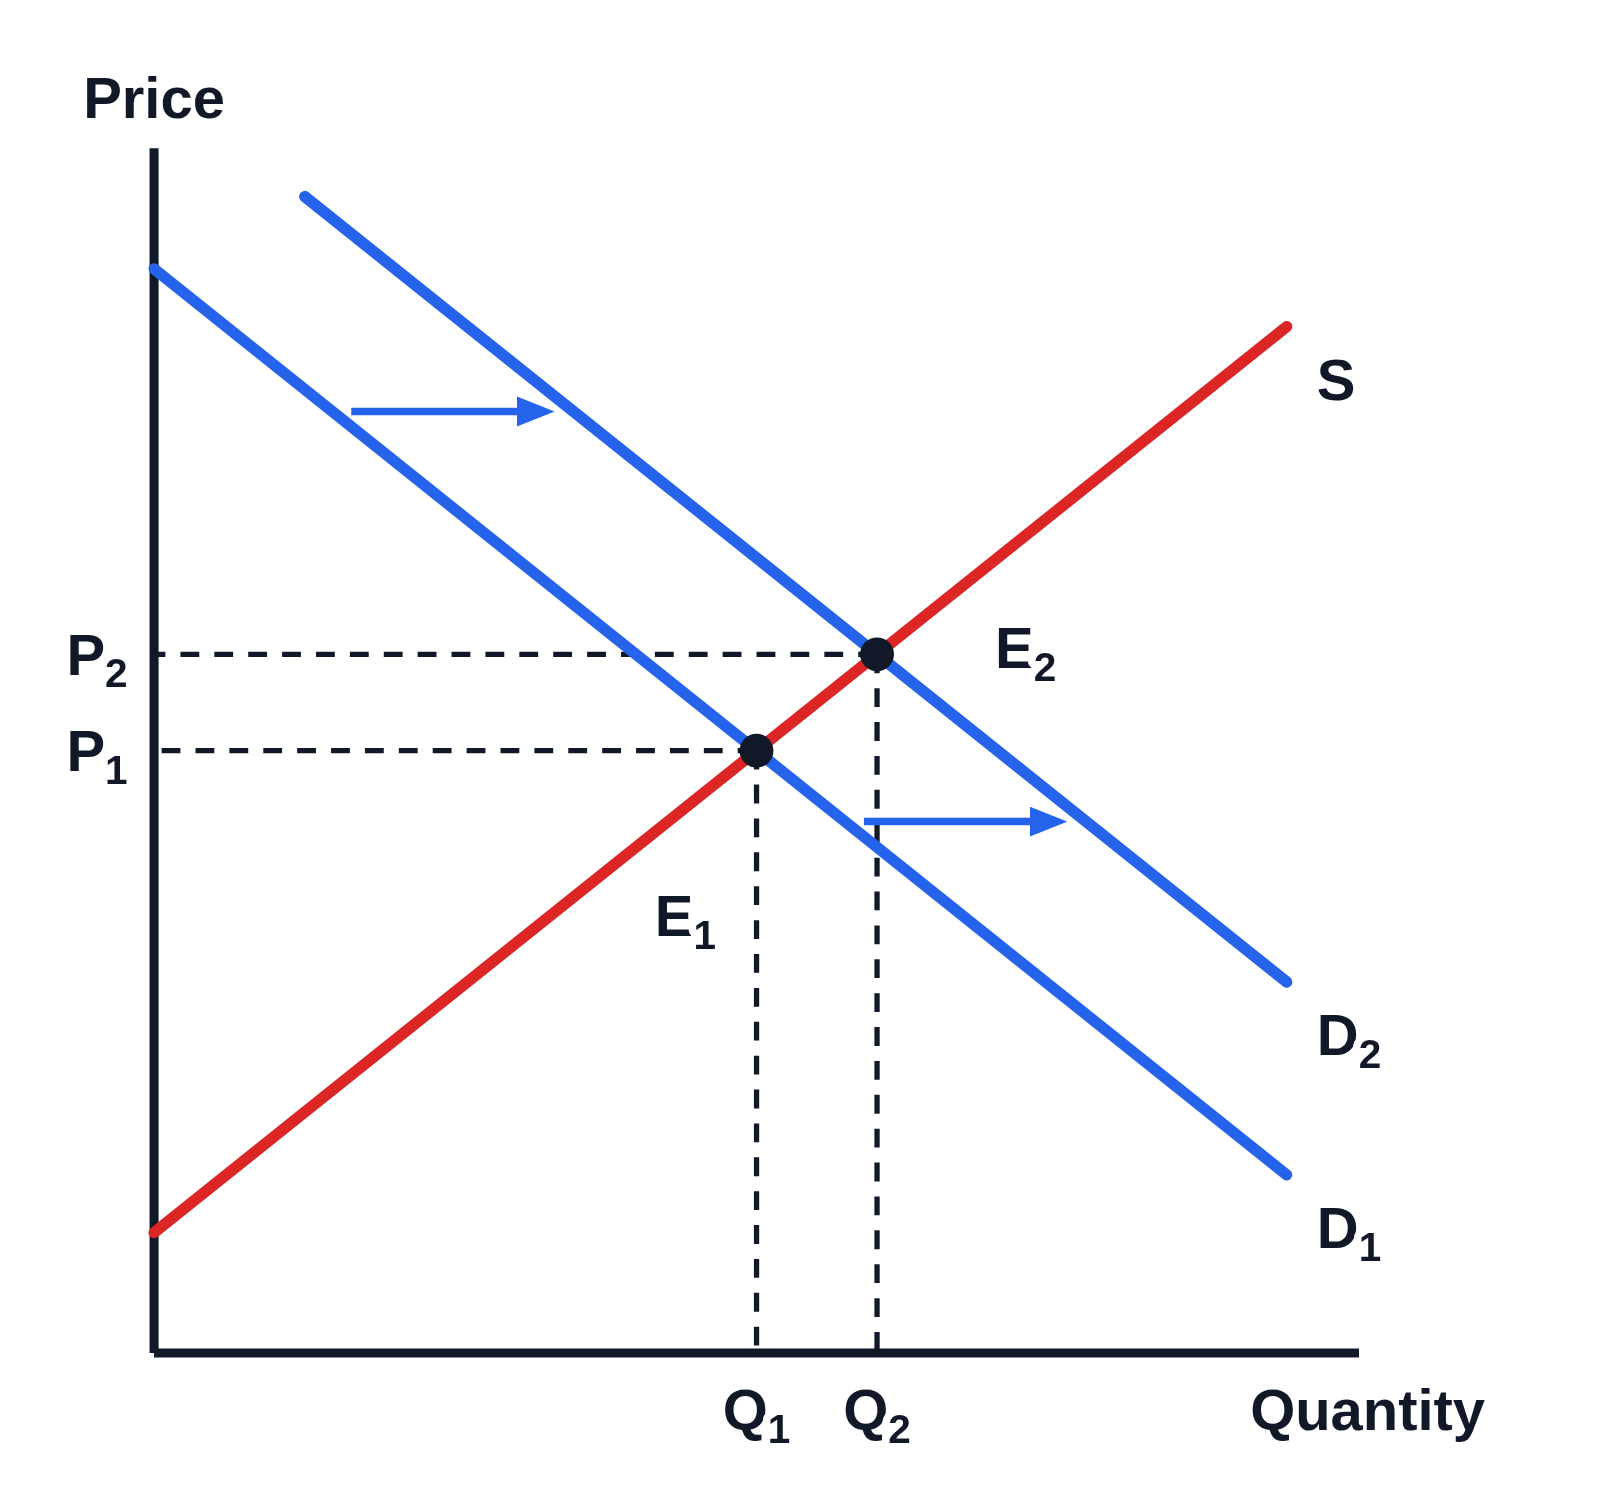
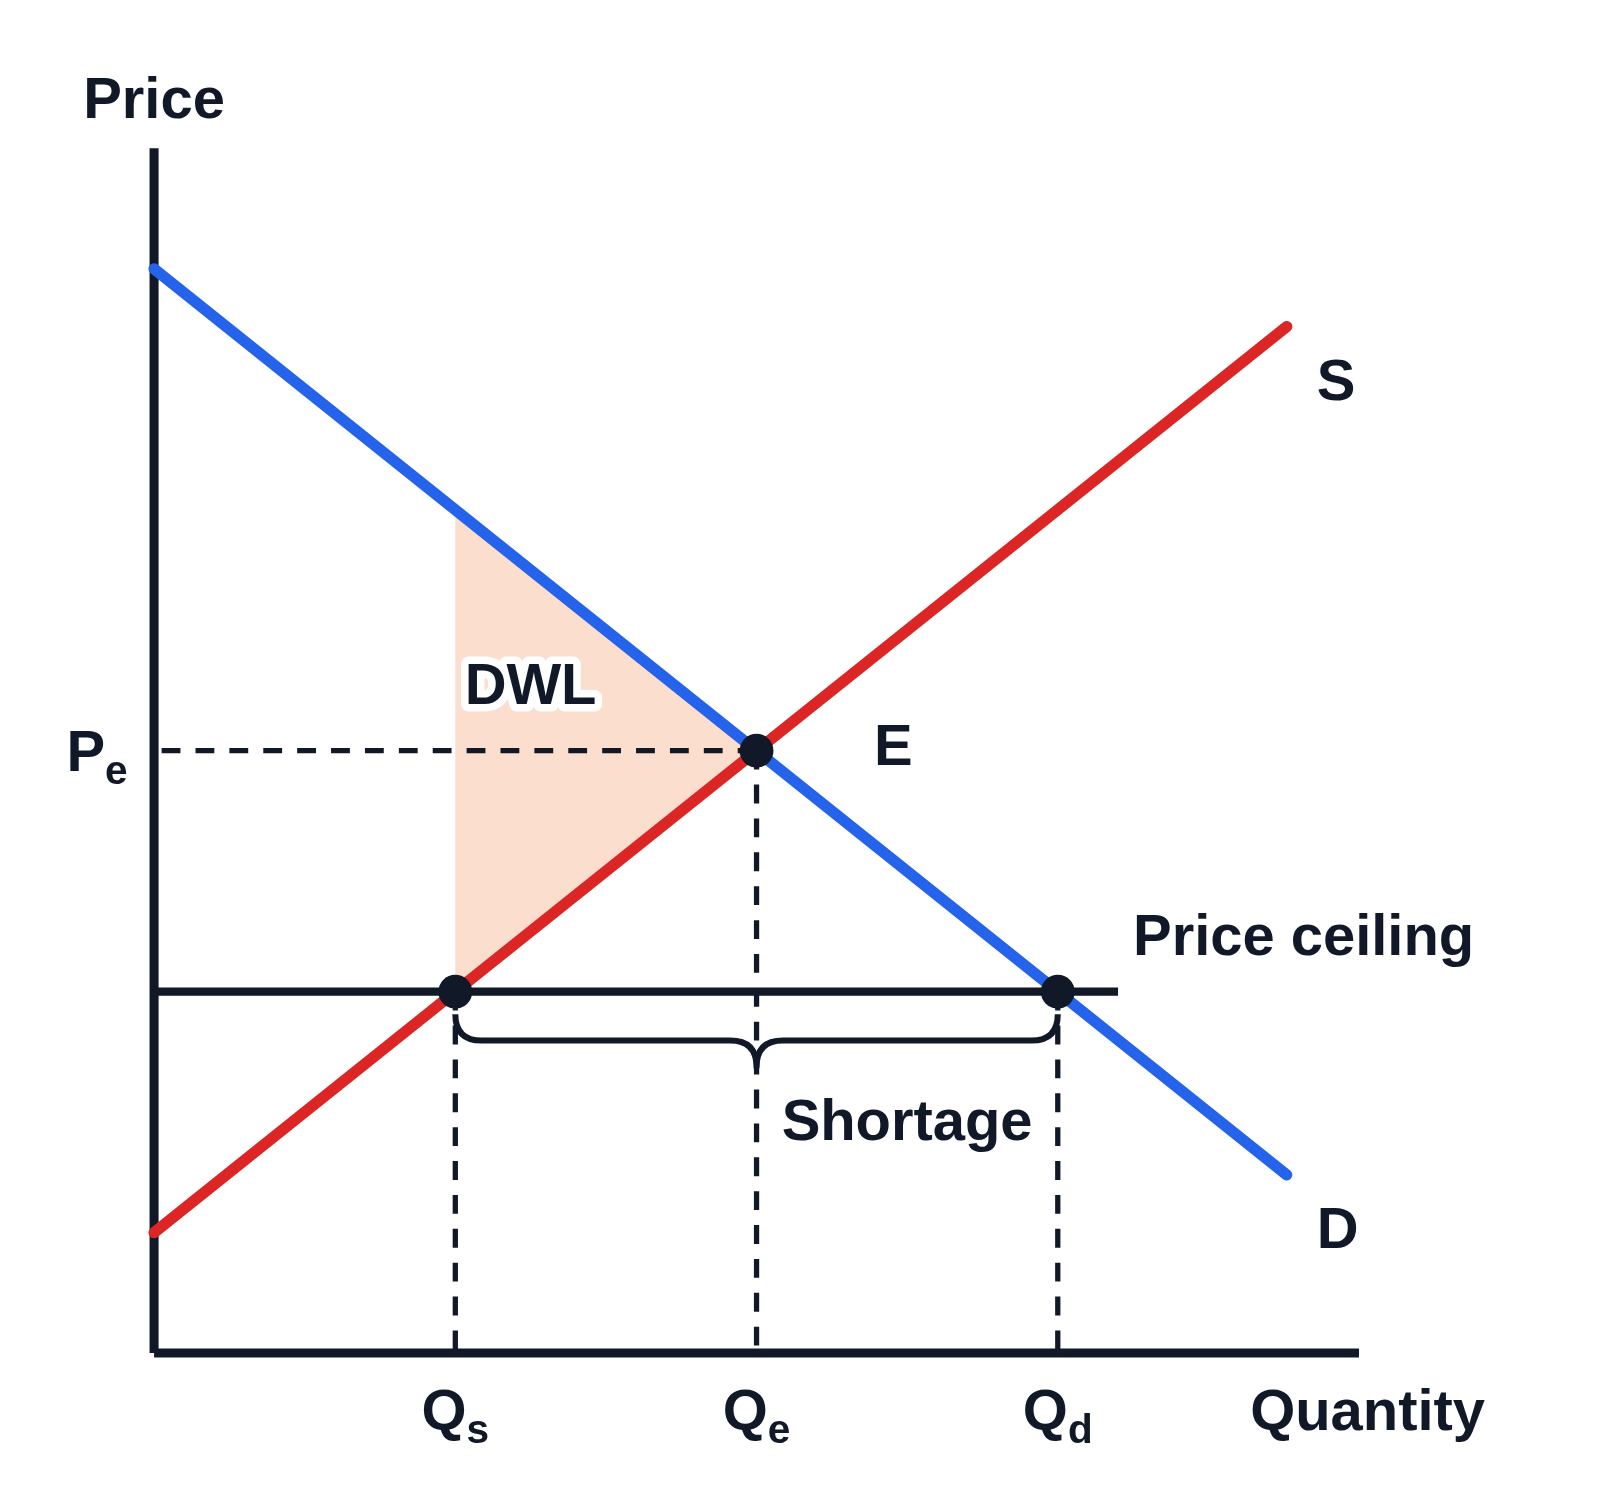
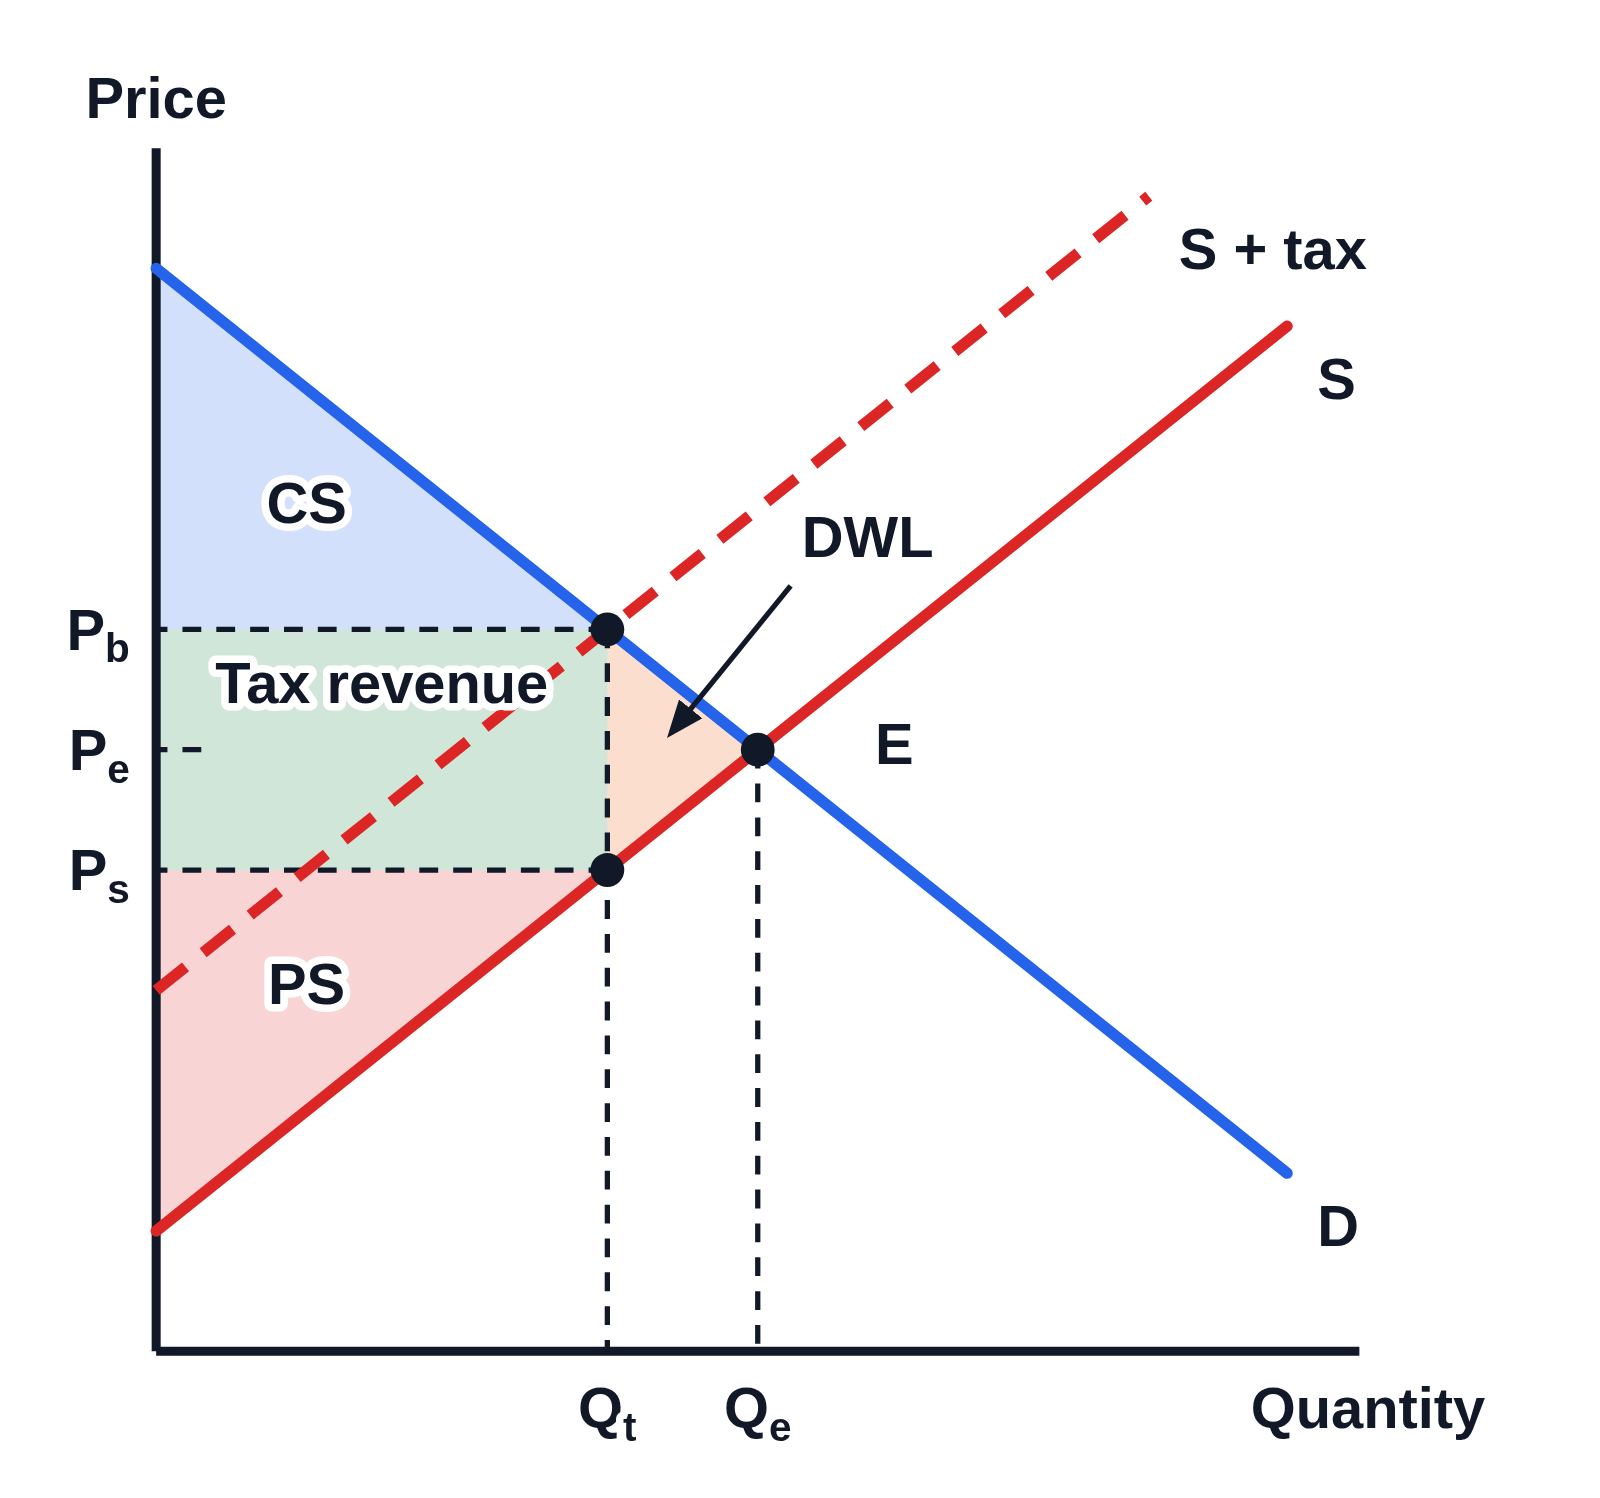
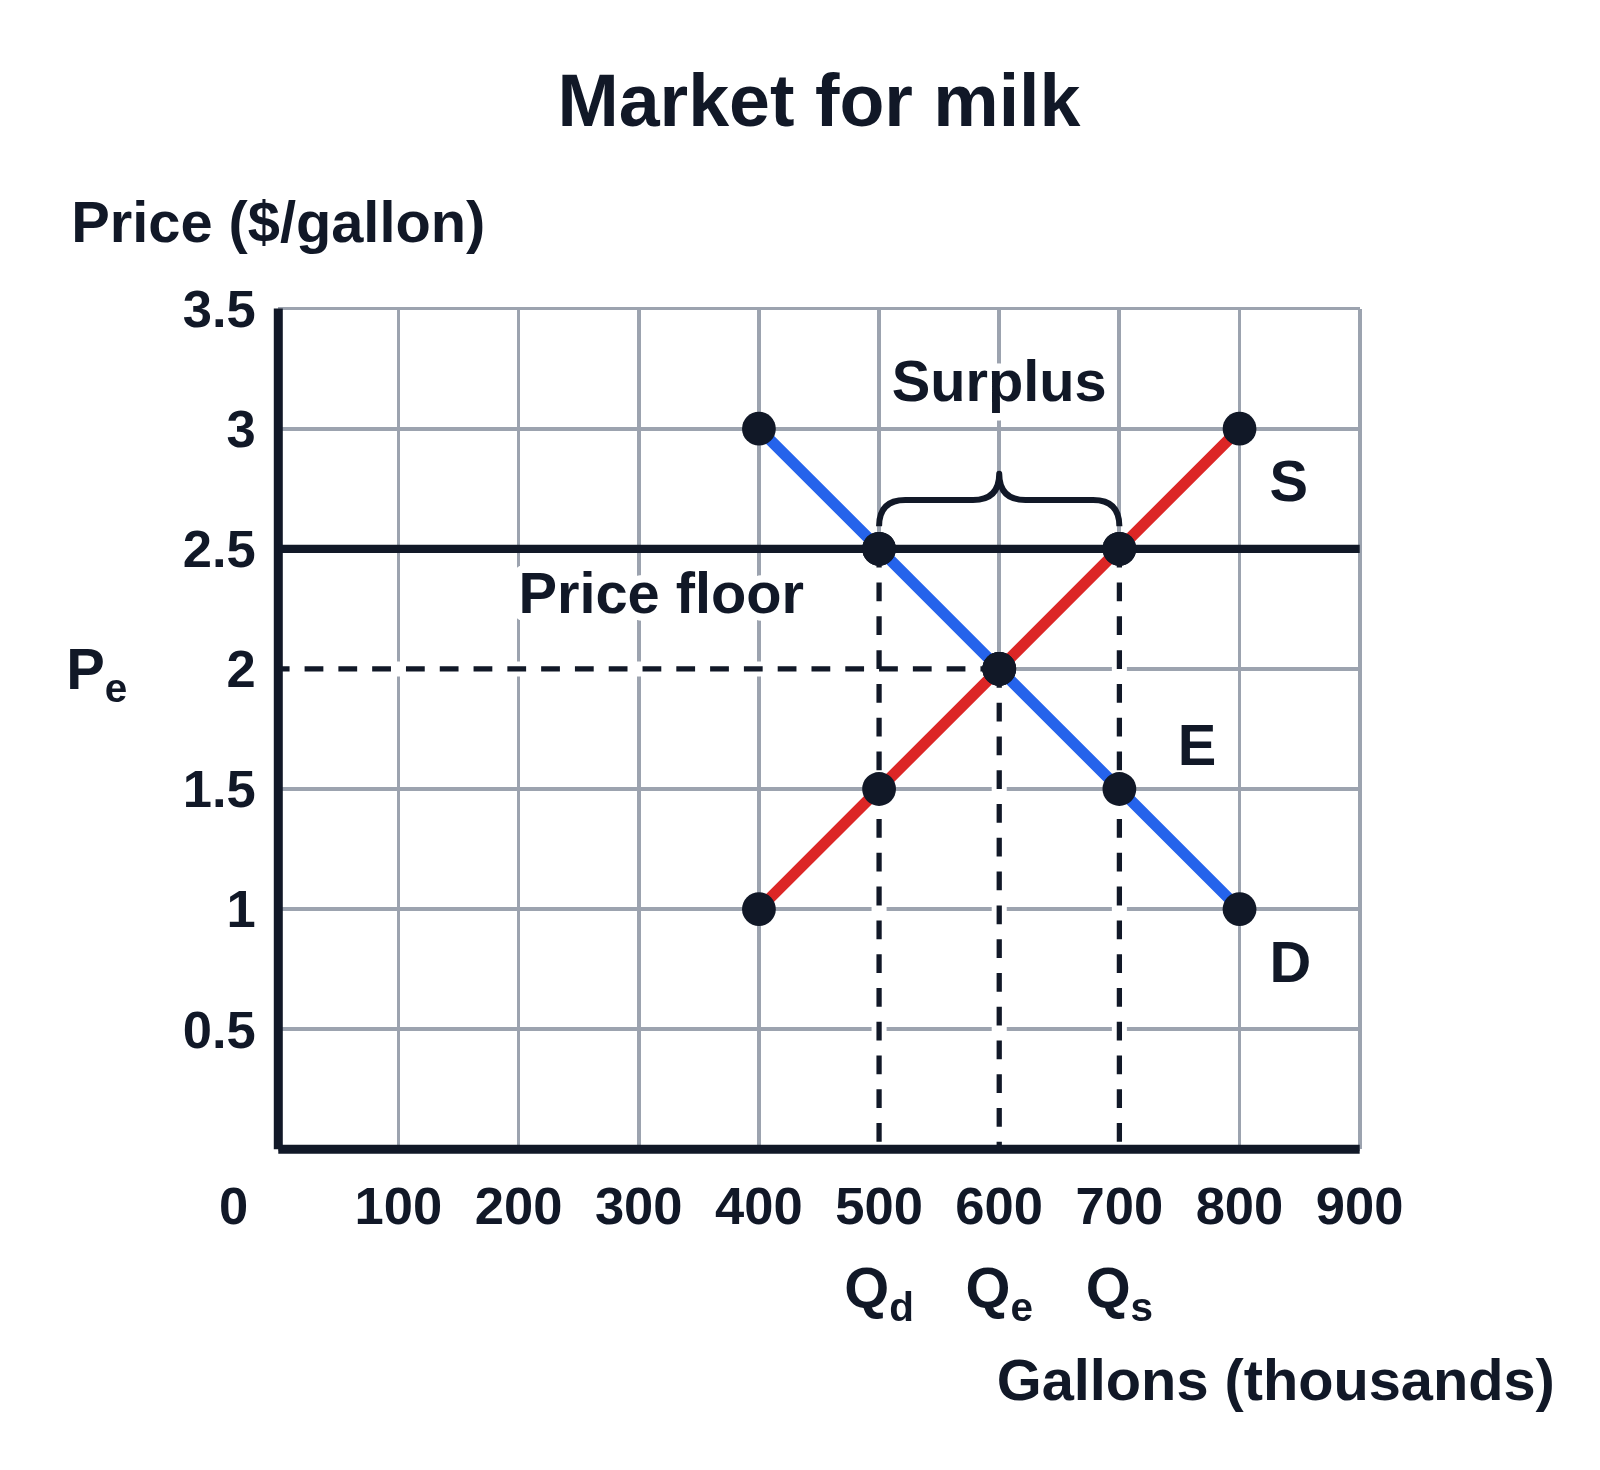
An example figure from the Supply and Demand generator.

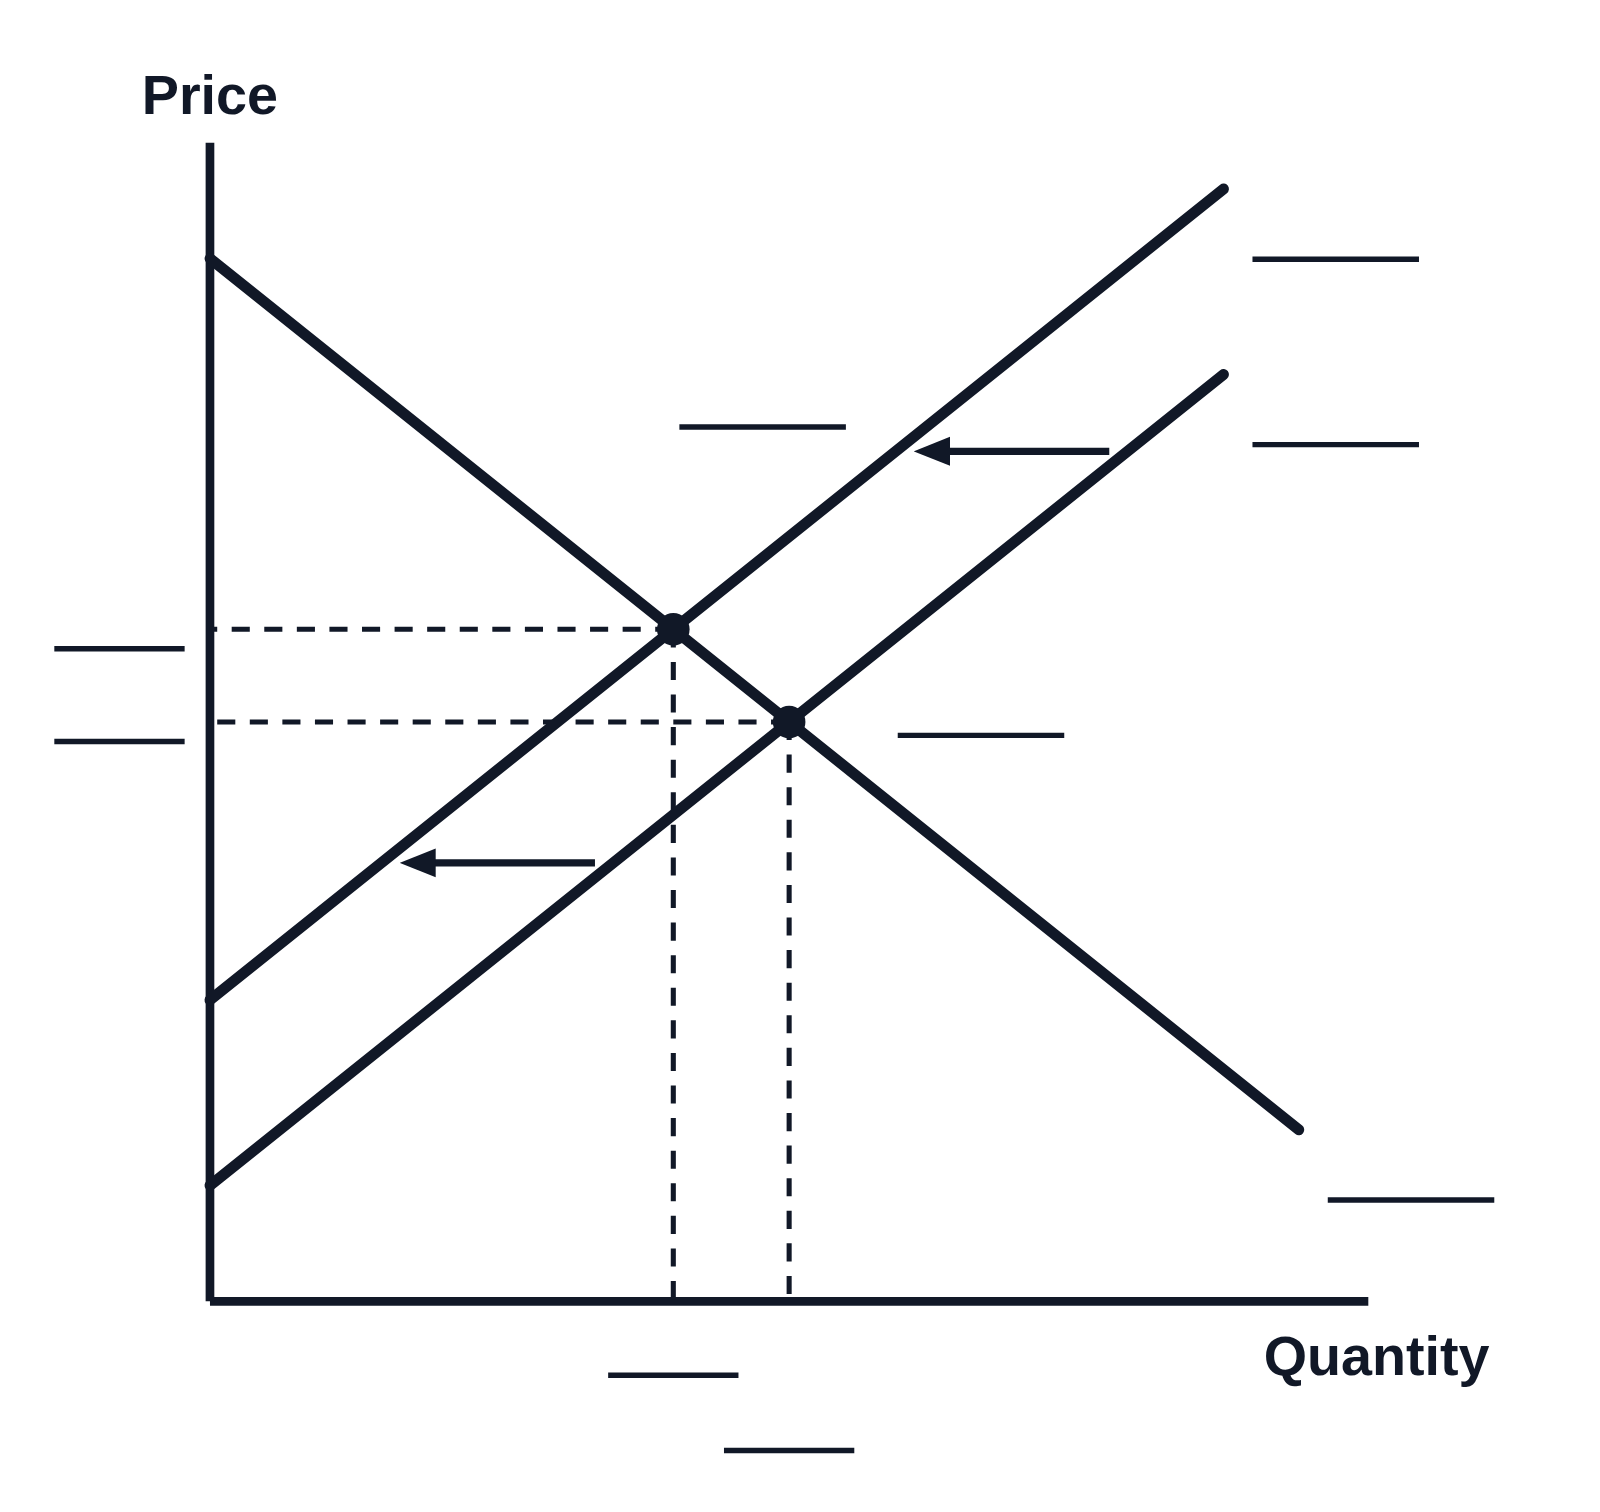
Black and white supply and demand graph with no numbers on the axes, Price up the side and Quantity along the bottom: a downward-sloping demand curve and an upward-sloping supply curve shifting left, with two arrows from the first supply curve to the second, and two equilibrium points with dashed lines to both axes. Every curve, point, price and quantity has a blank line for students to label
A worksheet graph of a decrease in supply, in black and white with no numbers on the axes. The supply curve shifts left, shown by two arrows, and the equilibrium moves up along the demand curve to a higher price and a lower quantity. The curves, both equilibrium points and their prices and quantities at the axes are each left as a blank line for students to label.

Editing opens it in Supply and Demand with these settings, to change anything and copy or download your own.

Free to use in your tests, worksheets, slides or anything else, no credit needed. Public domain under CC0 1.0. How to reuse our figures

More Supply and Demand examples